


Break Even Analysis Template for PowerPoint & Google Slides black
This template is part of a deck featuring multiple slides. To check out all slides.
See All
Product Description
Business Break Even Point Analysis Presentation Template
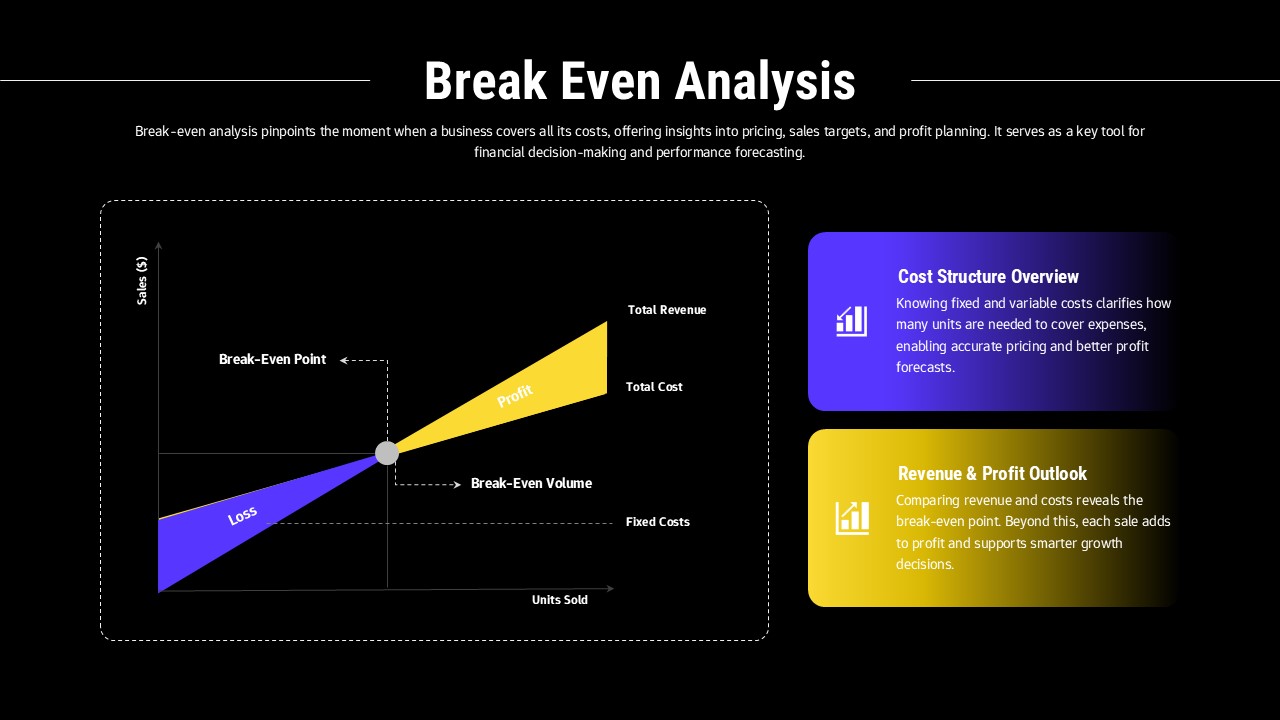
This break even analysis slide is designed to clearly explain the relationship between costs, revenue, and profit in a simple, visual format. The layout centers on a break-even chart that illustrates loss, profit, fixed costs, total costs, and total revenue across units sold. By highlighting the exact break-even point, the slide helps audiences quickly understand when a business transitions from loss to profit. The clean axes, directional labels, and color-coded zones make financial concepts easier to grasp, even for non-financial stakeholders.
Ideal for business planning and financial storytelling, this break even analysis presentation supports discussions around pricing strategies, sales targets, and cost management. Supporting content panels on the right summarize cost structure and revenue outlook, reinforcing key insights without overwhelming the main chart. The balanced composition ensures that both visual learners and detail-oriented viewers can follow the narrative with ease.
Fully editable in PowerPoint and Google Slides, this break even analysis chart can be customized with your own figures, labels, and brand colors. You can adapt it for startup pitches, financial reports, classroom instruction, or executive reviews. Whether you are explaining profitability thresholds, forecasting performance, or justifying strategic decisions, this break even analysis slide delivers clarity, professionalism, and decision-ready insights in a single view.
Features of this break even analysis template
• Break-even chart showing loss, profit, fixed costs, and revenue lines.
• Clearly marked break-even point and sales volume axis.
• Supporting callout panels for cost structure and revenue insights.
• Fully editable data, text, and colors in PowerPoint and Google Slides.
Why use this break even analysis template
• Simplifies complex financial concepts into a clear visual.
• Helps stakeholders understand profitability thresholds quickly.
• Strengthens pricing, budgeting, and forecasting discussions.
• Saves time compared to building financial charts from scratch.
Who is it for
Startup founders, financial analysts, business managers, consultants, educators, and students explaining cost–revenue relationships, profitability analysis, or financial planning concepts.
Login to download this file