Beyond the Slides
Master PowerPoint, Google Slides, and presentation strategy with expert articles, tutorials, and creative inspiration.
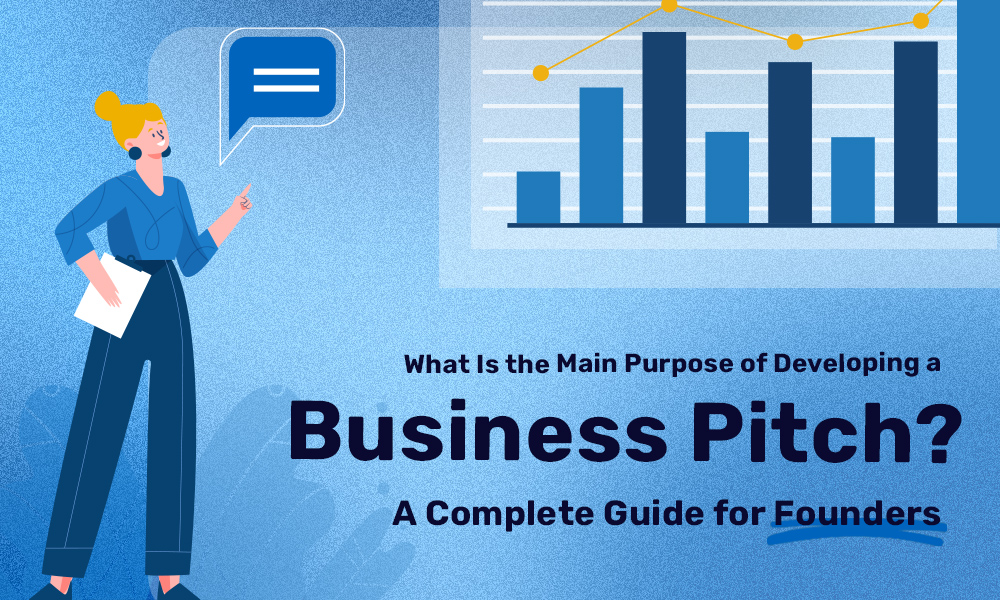
What Is the Main Purpose of Developing a Business Pitch? A Complete Guide for Founders
The Role of a Business Pitch in Winning Opportunities Many founders, professionals, and teams struggle with the same challenge: they have a strong idea, but their business pitch does not communicate it clearly. The slides feel disconnected. The story lacks focus. The audience walks away unsure about the value or the next step. Understanding what…

How to Structure a Persuasive Speech People Actually Remember
A persuasive speech lives or dies in the first thirty seconds. You can have the strongest argument in the room, but if your opening doesn’t earn attention, the rest of your points are wasted breath. Most speakers spend weeks polishing their words and almost no time thinking about how those words are supported visually, which…

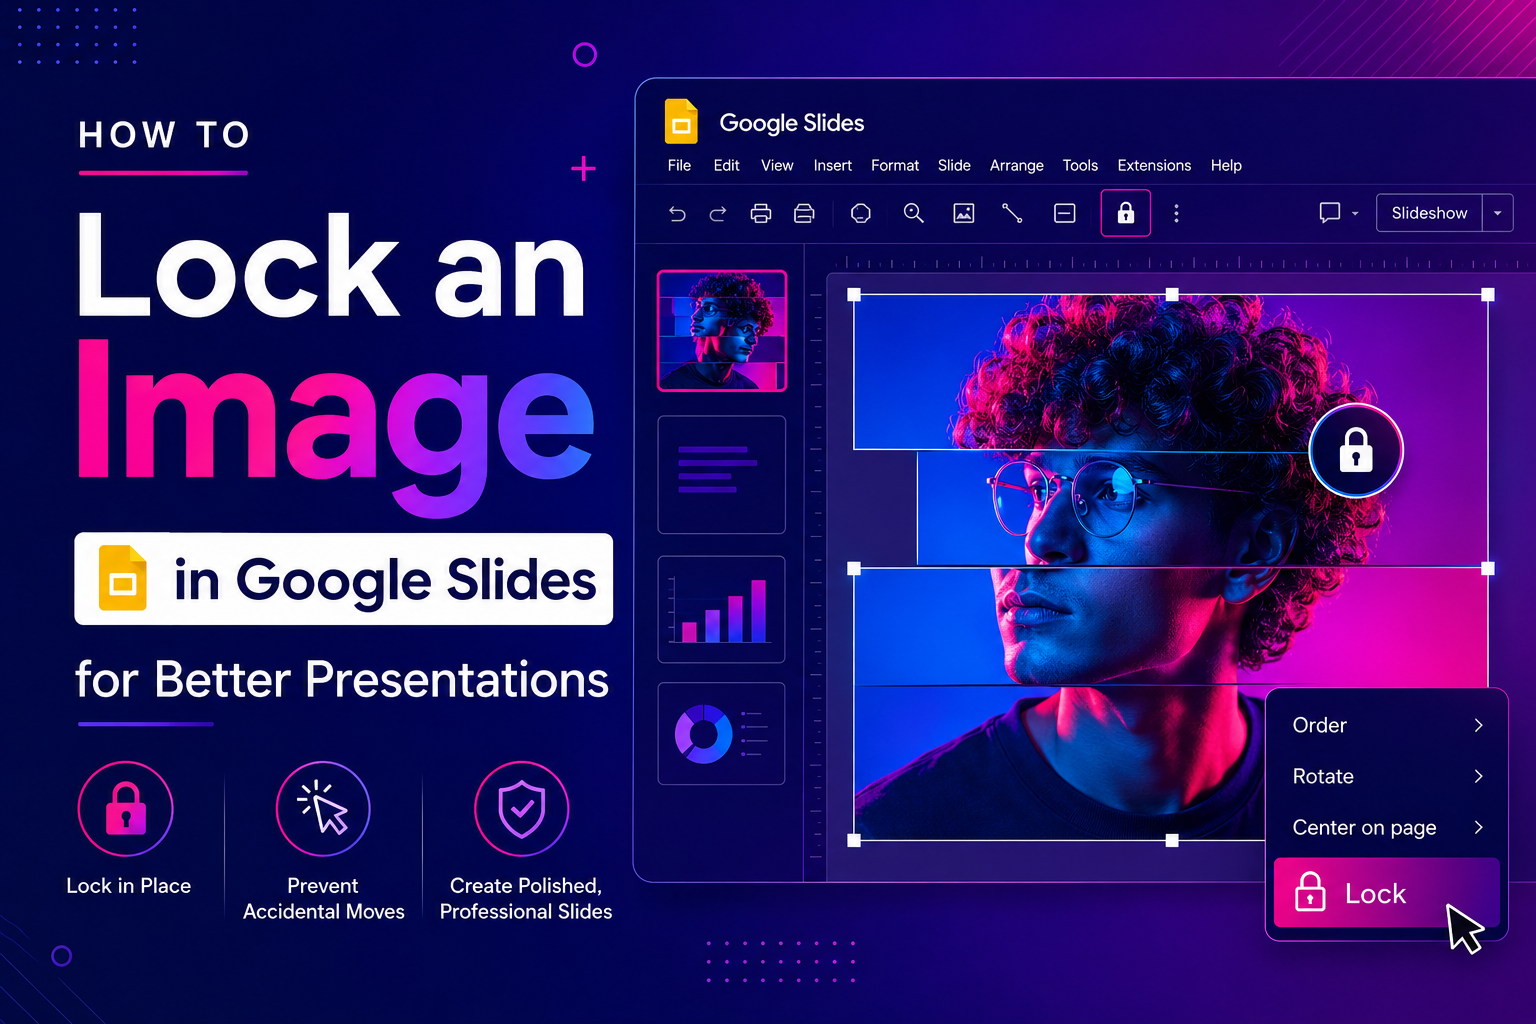
How To Lock an Image in Google Slides for Better Presentations
You’ve spent time arranging a polished slide layout in Google Slides, only to nudge an image by accident and throw everything off. If you’ve been there, you already know why learning how to lock an image in Google Slides is worth a few minutes of your time. SlidesDepot has seen this frustration come up again…
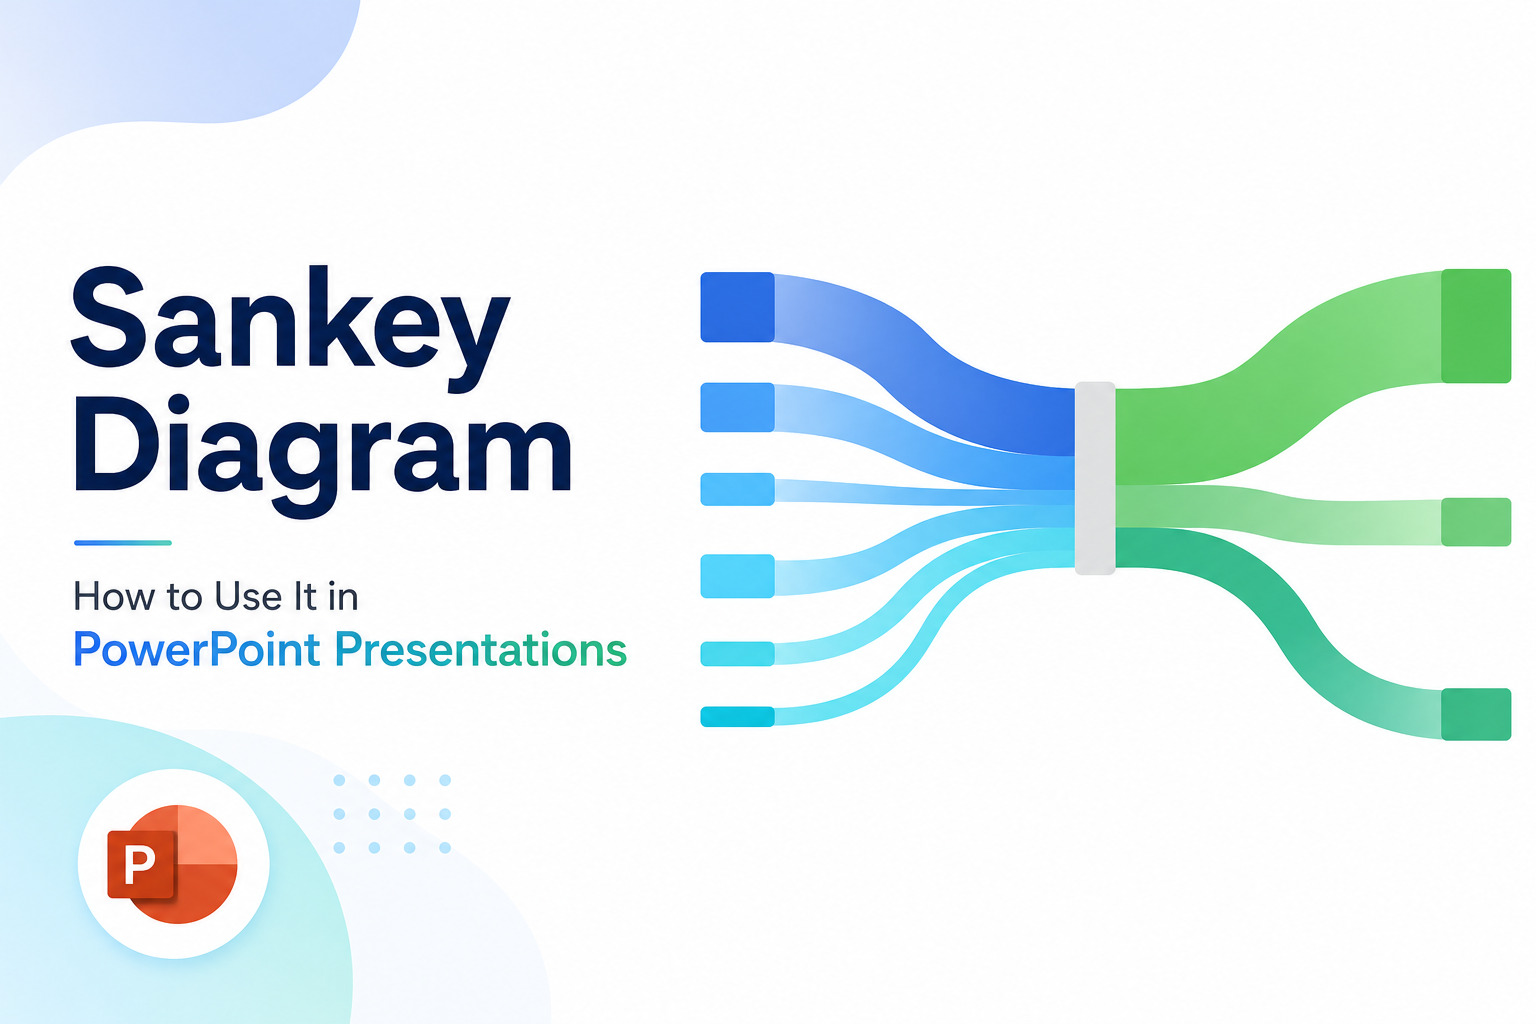
What Is a Sankey Diagram? How to Use It in PowerPoint Presentations
Some data tells a story the moment you see it. Flow data rarely does, not in a spreadsheet anyway. Numbers showing how budget moves across departments, how users drop off through a funnel, or how energy gets distributed through a system need a visual form before they start making sense. That is exactly what a…
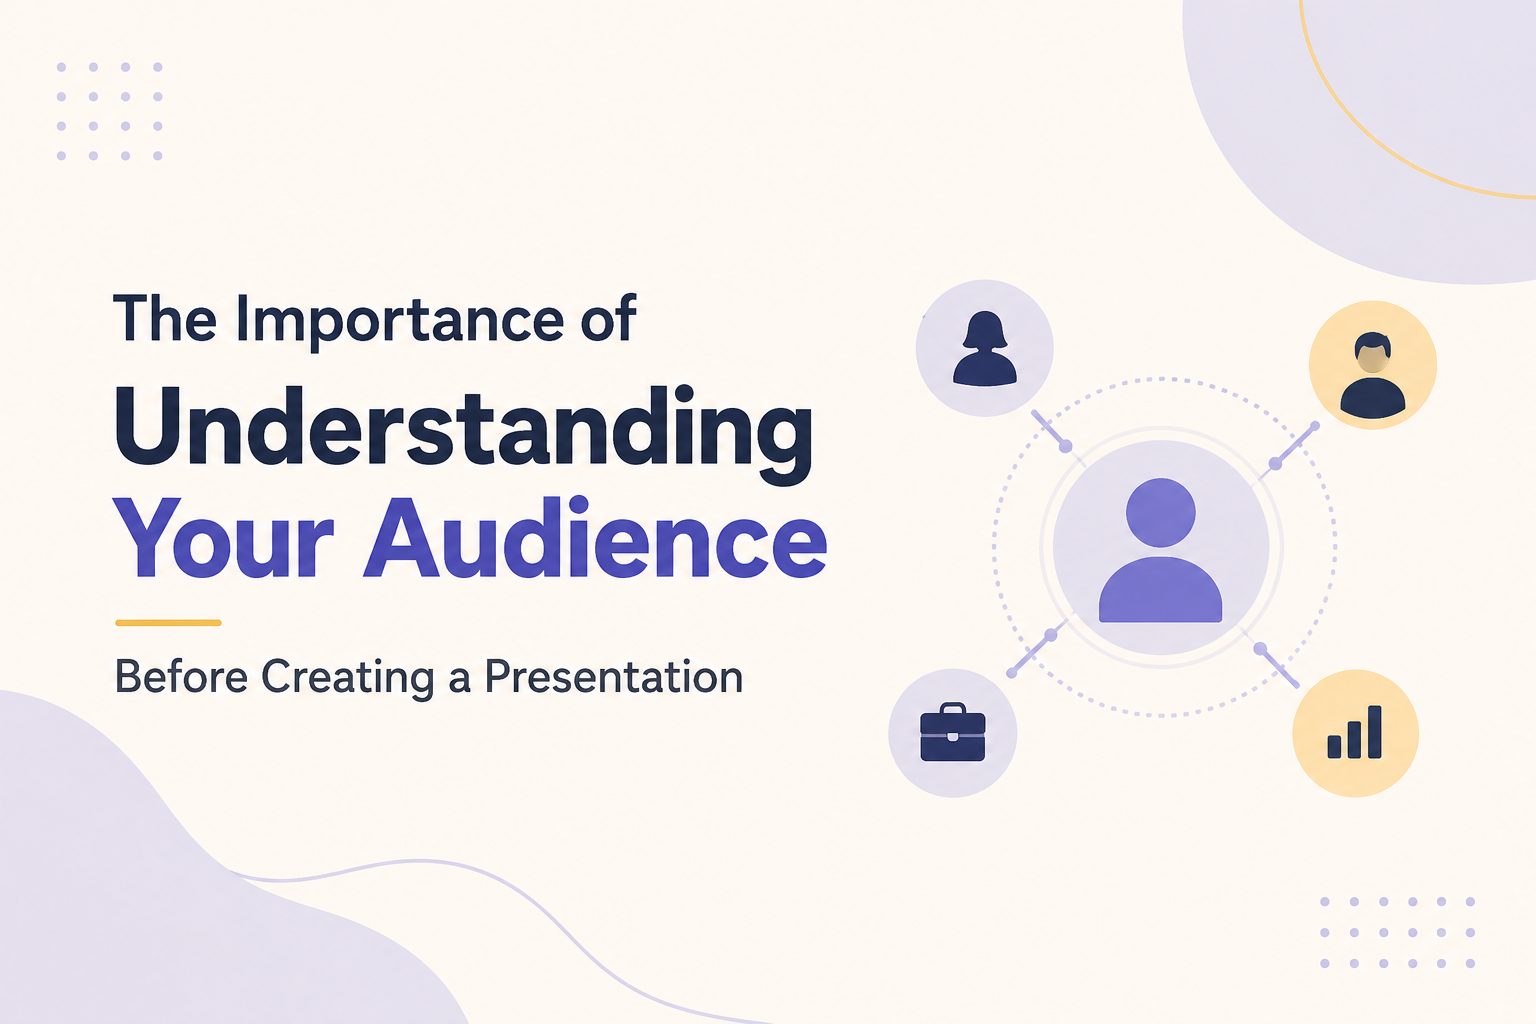
Why Understanding Your Target Audience Matters
Picture this. You spend hours building a presentation. The slides look clean. The data is solid. You feel ready. Then you walk into the room and something is immediately off. The audience looks confused. Some look bored. A few are already on their phones. What went wrong? You had great content but built it for…
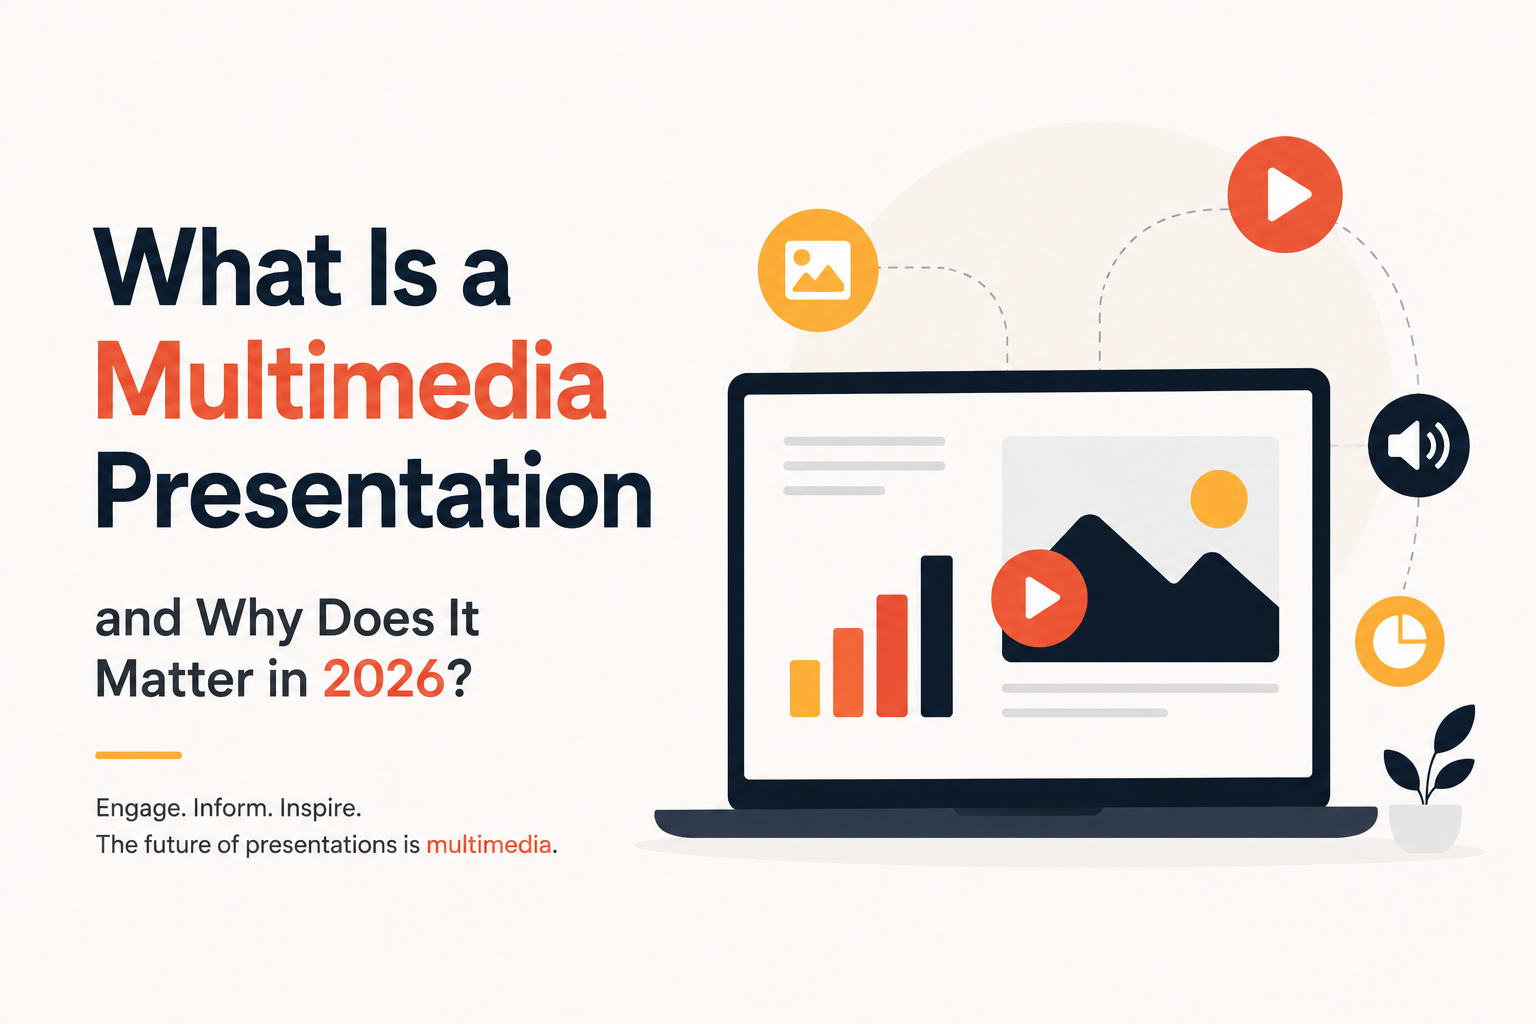
What Is a Multimedia Presentation and Why Does It Matter in 2026?
Picture two slide decks. One is plain text, slide after slide, in the same gray bullet format you’ve seen a hundred times. The other has a short product clip, a clean chart, and a quick voice note from a happy customer. The second one sticks with you days later, and the first one doesn’t. That…
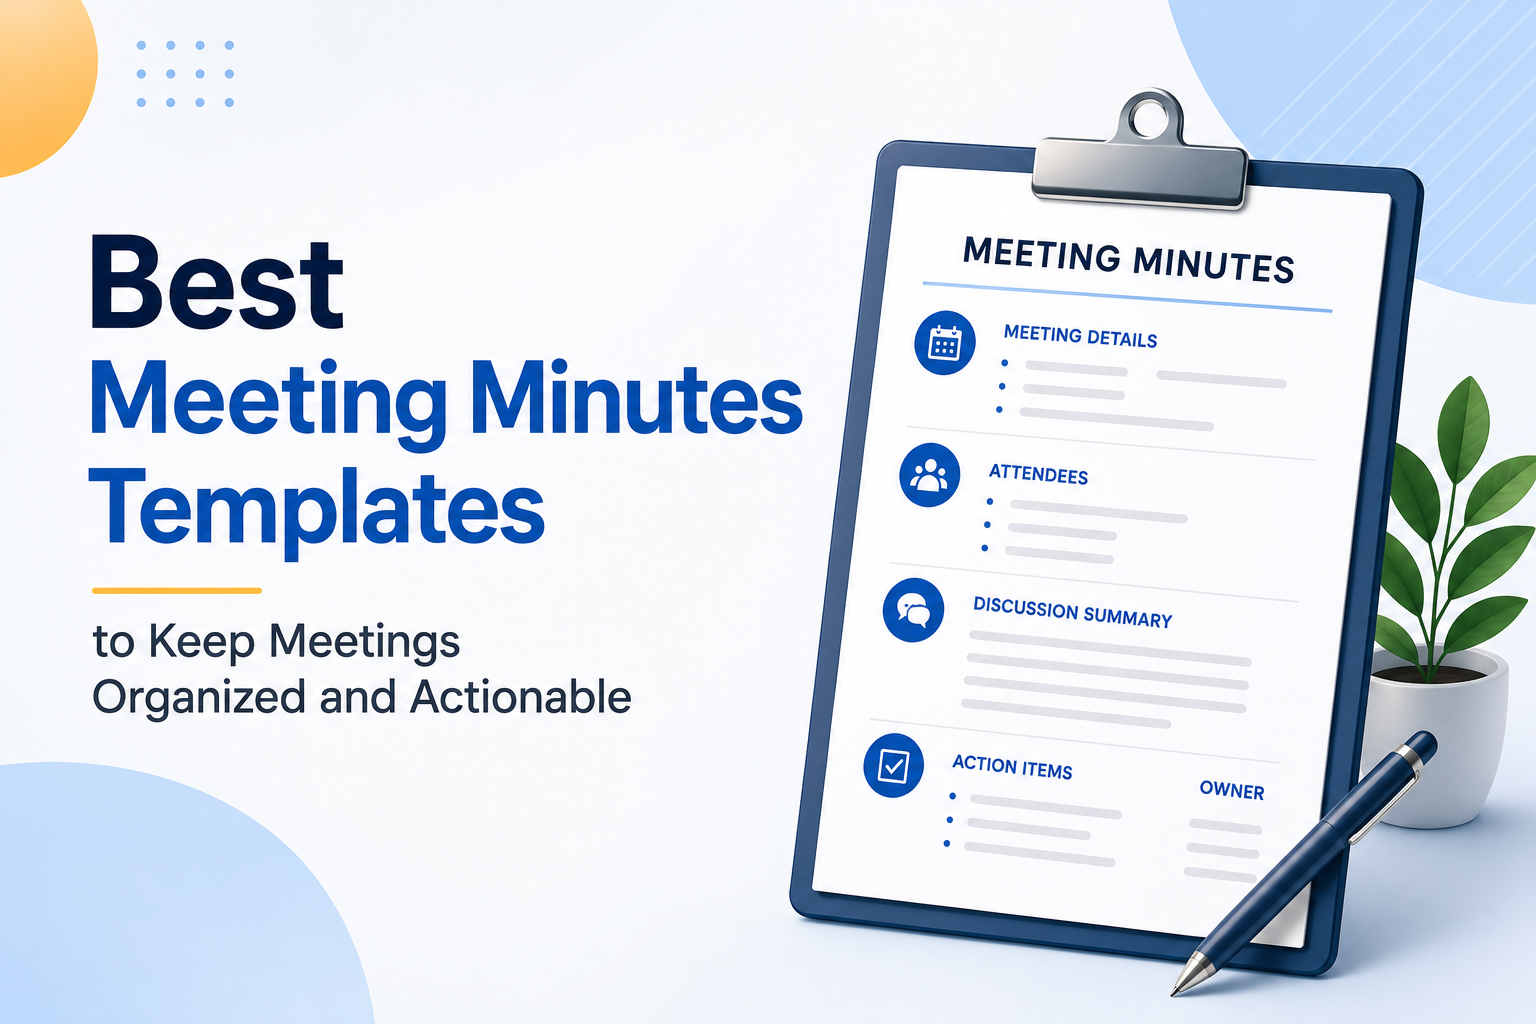
Best Meeting Minutes Templates to Keep Meetings Organized and Actionable
Most teams have sat through a meeting that felt productive in the moment, only to realize a week later that nobody can remember what was actually decided, or who was supposed to do what. The meeting itself wasn’t the problem. The way it was documented was. Good meeting minutes are what turn a conversation into…
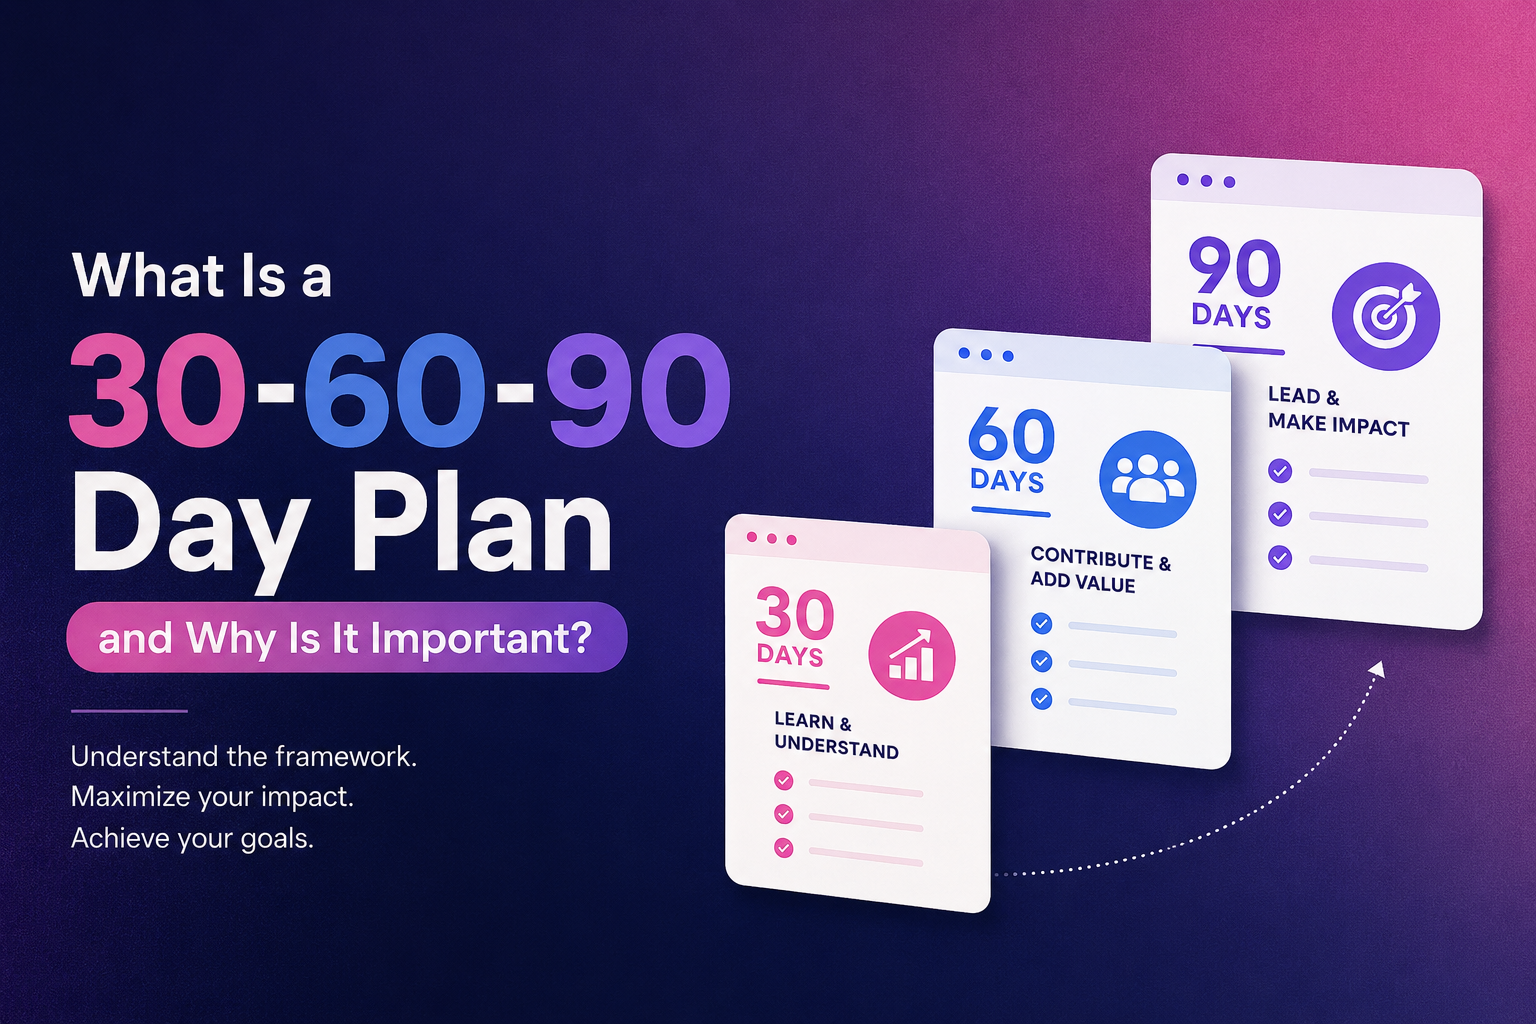
What Is a 30-60-90 Day Plan and Why Is It Important?
Starting something new, whether it is a job, a project, or a personal goal, often comes with a simple question: where do I even begin? A 30-60-90 day plan is one of the easiest ways to answer that question. It breaks down the first three months into three clear stages, so you always know what…

How to Make a Winning Business Presentation
A strong business presentation can open doors. It can close a deal, secure funding, align a team, or shift how stakeholders think about your work. A weak one, no matter how good the underlying idea is, often gets forgotten before the meeting room door closes. Making a compelling business presentation isn’t about being a design expert or…
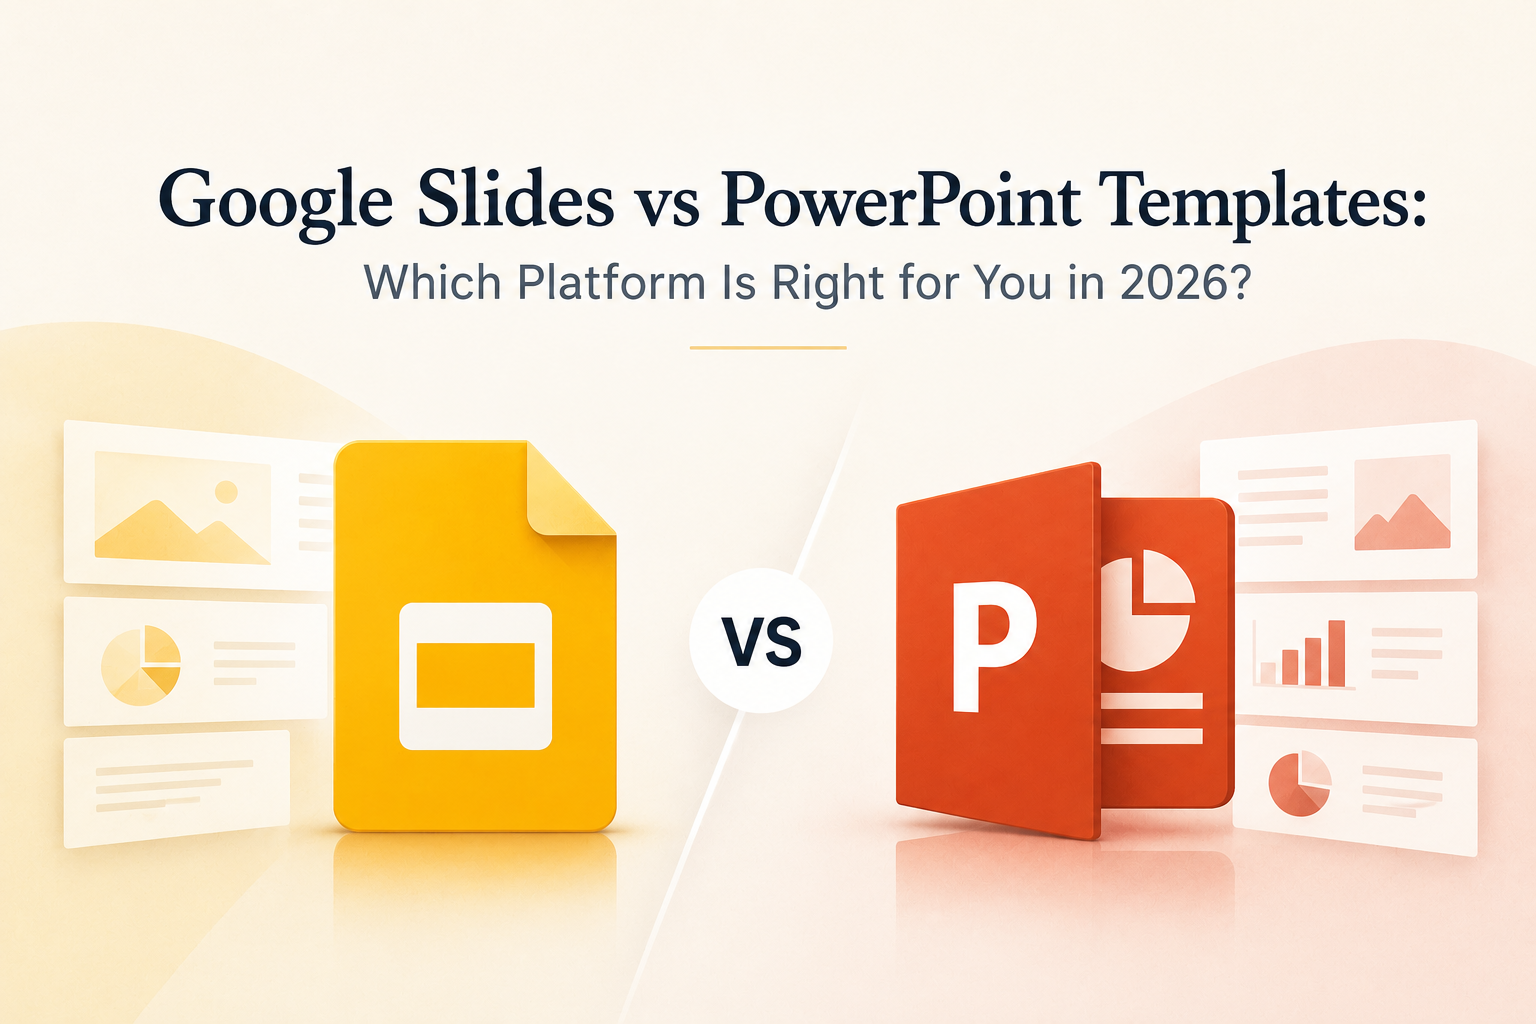
Google Slides vs PowerPoint Templates: Which Platform Is Right for You in 2026?
Picking the right presentation platform is one of those decisions that shapes how you work every single day. Google Slides and PowerPoint have both evolved significantly, and in 2026 they sit closer to each other in capability than ever before. Yet they still serve different workflows, different team structures, and different priorities. This guide covers…