


Iceberg Infographic Template for PowerPoint & Google Slides
This template is part of a deck featuring multiple slides. To check out all slides.
See AllProduct Description
Iceberg Model Visualization Presentation Template
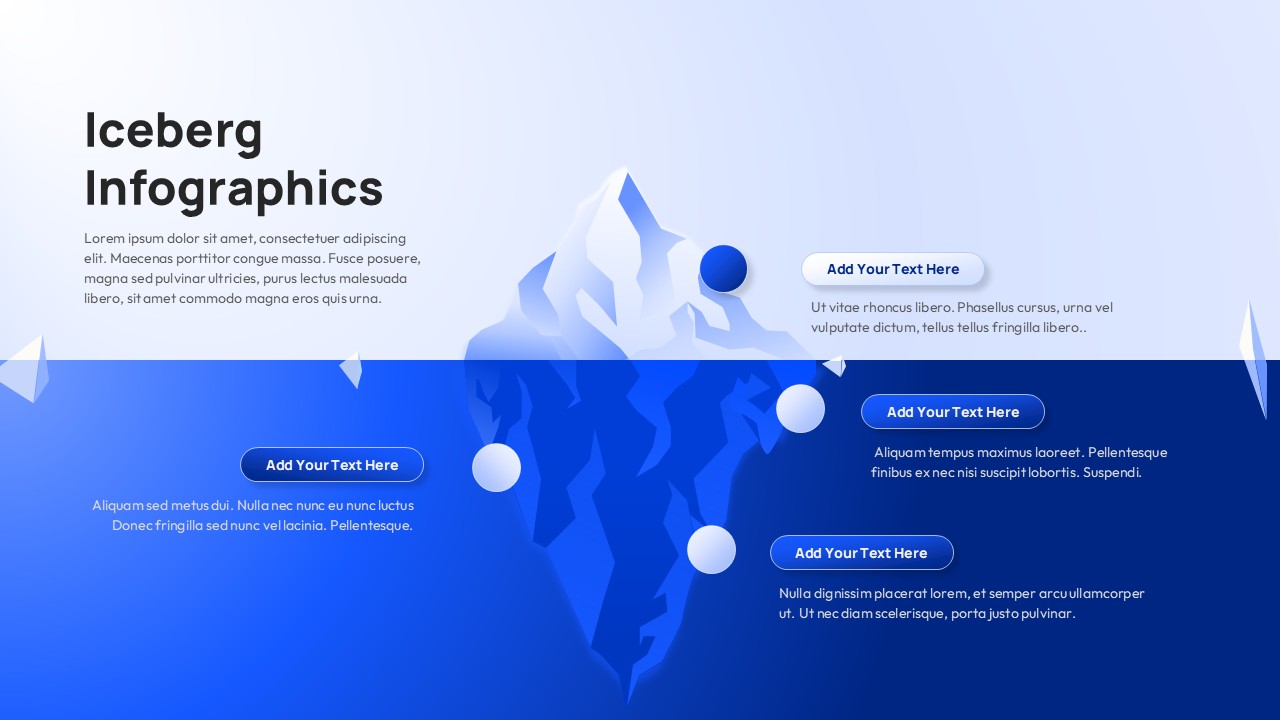
This Iceberg Infographic slide is designed to visually communicate hidden layers, underlying factors, and surface-level insights in a clear and compelling way. Featuring a large iceberg illustration divided by a horizontal waterline, this layout perfectly represents concepts where visible elements are supported by deeper, less obvious components. The Iceberg Infographic structure helps audiences instantly grasp contrasts such as seen vs unseen, known vs unknown, or symptoms vs root causes.
The slide balances content above and below the surface, with dedicated callout areas connected to different iceberg levels. This allows presenters to explain ideas progressively, guiding viewers from high-level observations to deeper analysis. The clean blue gradient, rounded labels, and modern illustration style keep the Iceberg Infographic visually engaging while maintaining a professional tone suitable for business, education, or strategy presentations.
Fully editable in PowerPoint and Google Slides, this presentation template adapts easily to various use cases. You can relabel sections, adjust colors, or expand explanations without disrupting the visual hierarchy. Whether you are explaining risks, behaviors, data insights, organizational challenges, or strategic foundations, this Iceberg presentation template helps transform complex concepts into a story that is easy to understand, remember, and present with confidence.
Features of this Iceberg Infographic template
• Iceberg visual divided into above-water and below-water sections.
• Multiple callout labels for layered explanations and annotations.
• Clean blue gradient background with modern infographic styling.
• Fully customizable text, colors, and layout in PowerPoint and Google Slides.
Why use this Iceberg Infographic template
• Clearly illustrates hidden factors behind visible outcomes.
• Improves audience understanding of complex or abstract concepts.
• Supports storytelling, analysis, and strategic discussions.
• Saves design time with a ready-to-use Iceberg Infographic layout.
Who is it for
This slide is ideal for consultants, educators, analysts, managers, and trainers who need to explain root causes, behavioral models, risks, or strategic foundations. It works well for workshops, strategy sessions, reports, and educational presentations.
Login to download this file