


Free Iceberg Diagram Concept Slide Modern Template for PowerPoint & Google Slides

Free Iceberg Diagram Visual Explanation Presentation Template
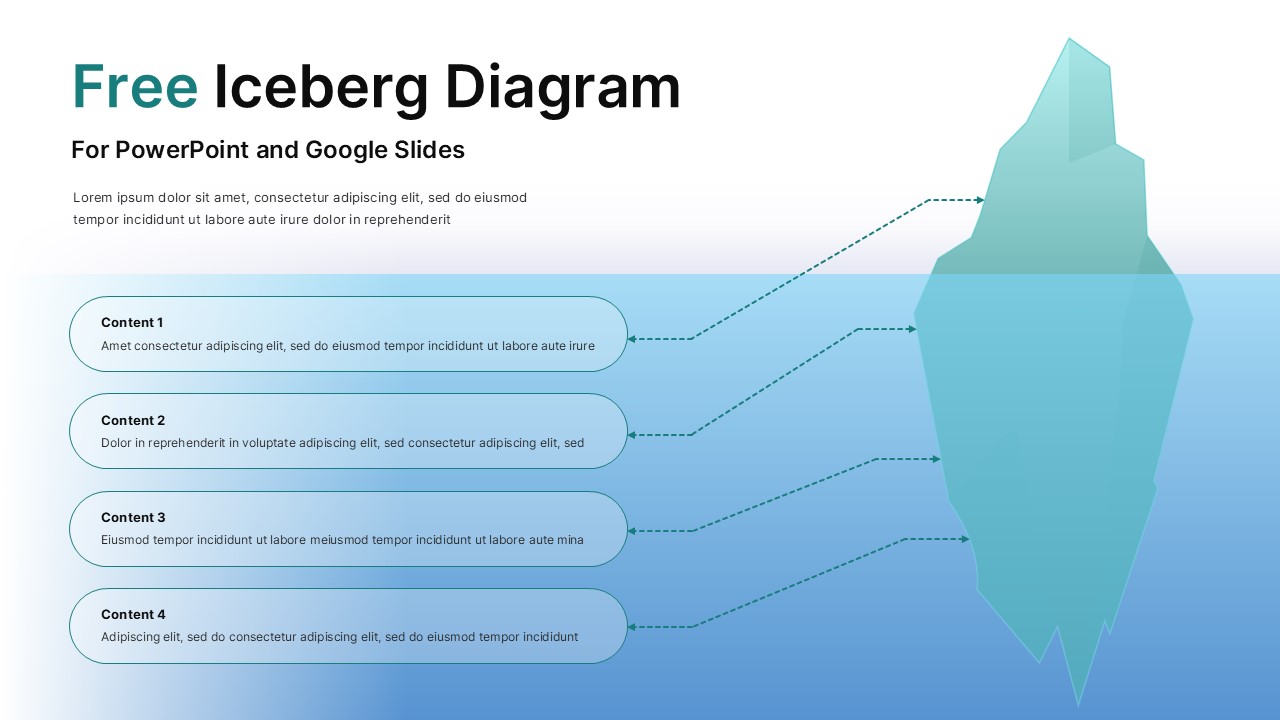
This Free Iceberg Diagram slide is designed to help presenters clearly explain visible versus hidden factors within complex topics, strategies, or systems. Using a large iceberg illustration split by a waterline, the layout visually separates surface-level elements from deeper, underlying drivers that influence outcomes. The Iceberg Diagram structure supports logical storytelling by guiding audiences from what is immediately observable to what lies beneath, creating clarity and stronger analytical understanding. Clean typography, soft gradients, and directional dashed connectors ensure each point is easy to follow without overwhelming the viewer.
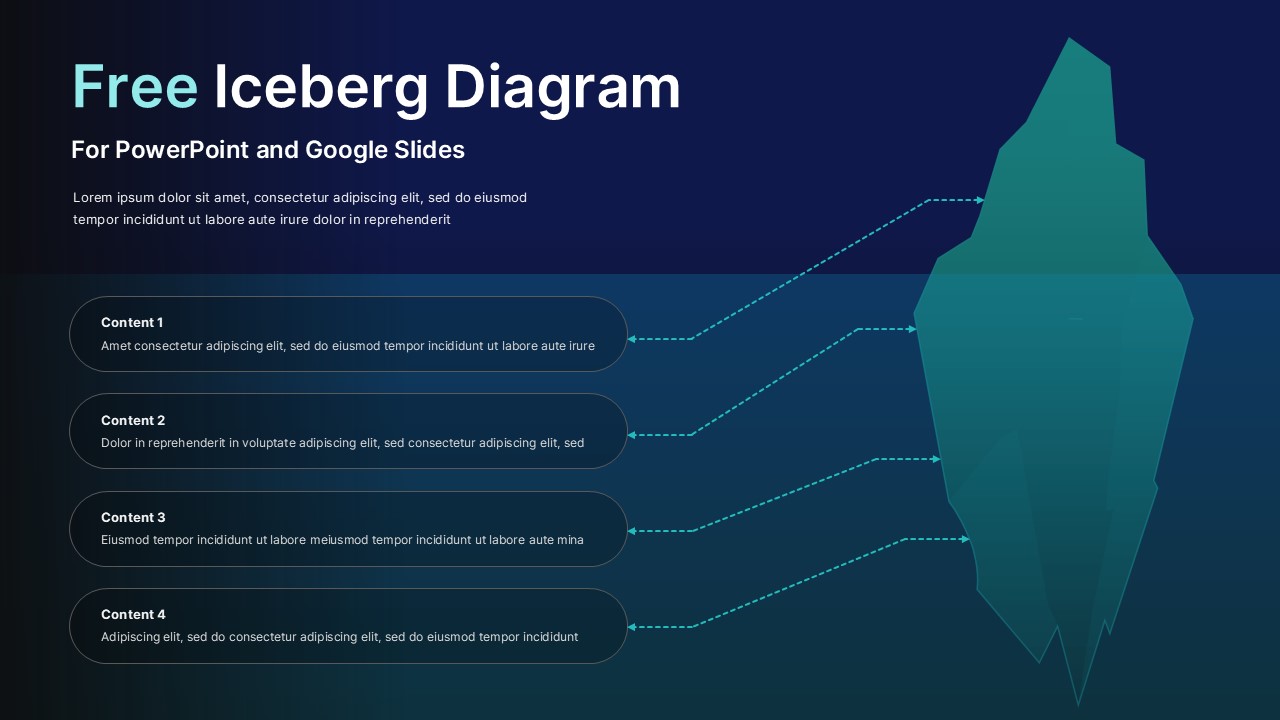
Built for business and educational use, this Iceberg Diagram enables presenters to map causes, risks, assumptions, and root issues in a structured, professional format. Four rounded content blocks align neatly with the iceberg shape, allowing balanced distribution of insights. Each section is fully editable, making it easy to adjust labels, text length, or emphasis depending on your message. The calm blue color palette reinforces clarity and focus, helping audiences absorb layered information efficiently during meetings or lectures.
This Iceberg Diagram works seamlessly in PowerPoint and Google Slides, preserving layout integrity across platforms. Whether you are breaking down organizational challenges, behavioral patterns, strategic risks, or research findings, this slide simplifies complex thinking into a single, memorable visual. By combining hierarchy, contrast, and spatial logic, the Iceberg Diagram encourages deeper discussion, supports critical thinking, and strengthens presentations that require explanation beyond surface-level data.
Features of this Free Iceberg Diagram template
• Large iceberg illustration with clear above-and-below water separation.
• Four aligned content areas with dashed connectors for visual flow.
• Fully editable text, shapes, and colors in PowerPoint and Google Slides.
• Clean, professional layout optimized for presentations and reports.
Why use this template
• Explains hidden causes and visible effects in one clear visual.
• Improves audience understanding of complex or abstract concepts.
• Saves time with ready-to-use structure and balanced layout.
• Works across strategy, education, analysis, and storytelling use cases.
Who is it for
Consultants, educators, business analysts, managers, and students explaining layered concepts, root causes, or strategic insights. Suitable for workshops, reports, lectures, and executive presentations.
Login to download this file


