


Four Step Gradient Progress Chart Template for PowerPoint & Google Slides

Four Stage Horizontal Progress Chart Presentation Template
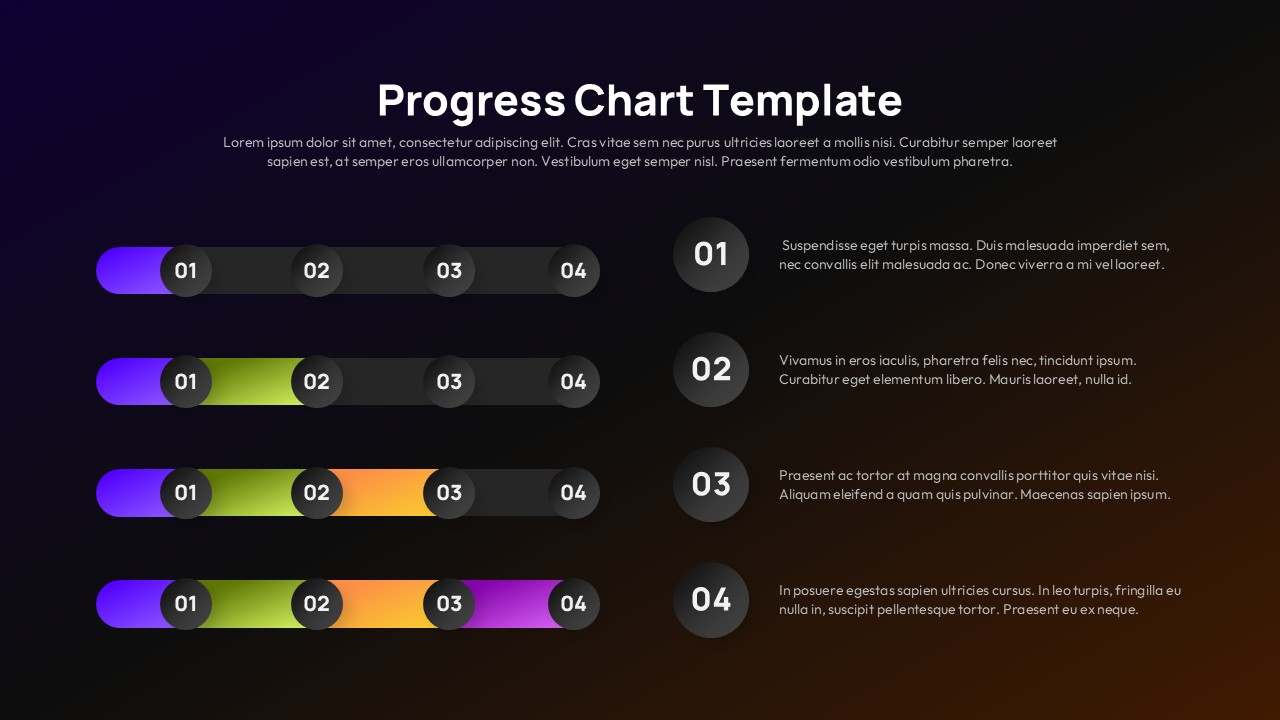
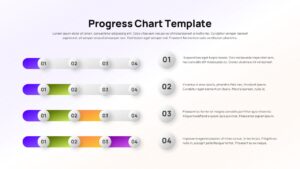
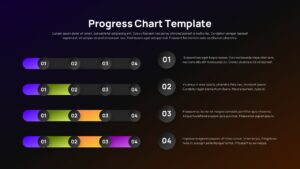
Present milestones and achievements with clarity using this four step gradient progress chart template for PowerPoint & Google Slides. Designed with a sleek horizontal layout, this slide visually represents project stages through four connected segments labeled 01 to 04. Each stage is highlighted with a vibrant gradient progression—from purple to green, orange, and magenta—creating a strong sense of forward movement and accomplishment. Circular step markers sit prominently above each segment, reinforcing structure and guiding the audience’s eye from start to finish.
This four step gradient progress chart template for PowerPoint & Google Slides pairs visual storytelling with practical functionality. On the right side, corresponding numbered content blocks allow you to elaborate on each milestone with supporting text, metrics, or action points. The soft shadows, rounded shapes, and balanced spacing deliver a clean, modern aesthetic that fits corporate updates, product roadmaps, performance reviews, and strategic reports. Fully editable elements make it easy to adjust colors, duplicate steps, or align the design with your brand identity.
Optimized for clarity and efficiency, this progress chart ensures that complex timelines or phased initiatives are communicated in a concise and engaging way. Whether used in executive briefings or team meetings, it transforms linear progress into a compelling visual narrative.
Features of this Four Step Progress Chart template
• Four connected horizontal progress bars with numbered circular markers (01–04).
• Gradient color transitions to visually represent advancement across stages.
• Right-aligned text placeholders mapped to each progress step.
• Editable shapes, colors, fonts, and sequence order for full customization.
Why use this Four Step Progress Chart template
• Clearly communicates phased progress in a structured, easy-to-follow layout.
• Enhances stakeholder understanding with visual step indicators.
• Saves preparation time with ready-to-use milestone formatting.
• Suitable for reports, project tracking, and roadmap presentations.
Who is it for
Project managers, team leaders, consultants, and business analysts who need to present phased initiatives or performance updates. It is also ideal for startups outlining product development stages, marketing teams reporting campaign progress, and executives delivering quarterly updates. Educators and trainers can leverage this layout to explain step-by-step processes or structured learning modules in a visually engaging way.
Login to download this file


