


Cause And Effect Diagram for PowerPoint & Google Slides Templates

Cause and Effect Diagram Presentation Template
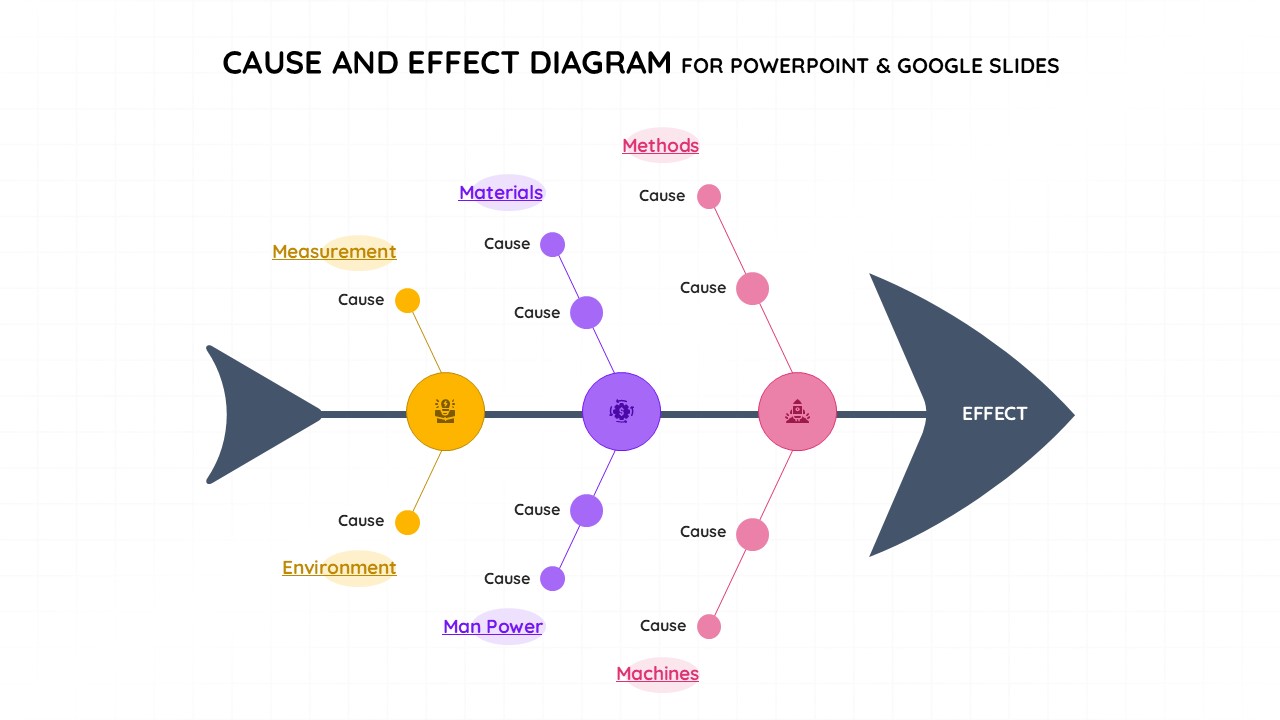
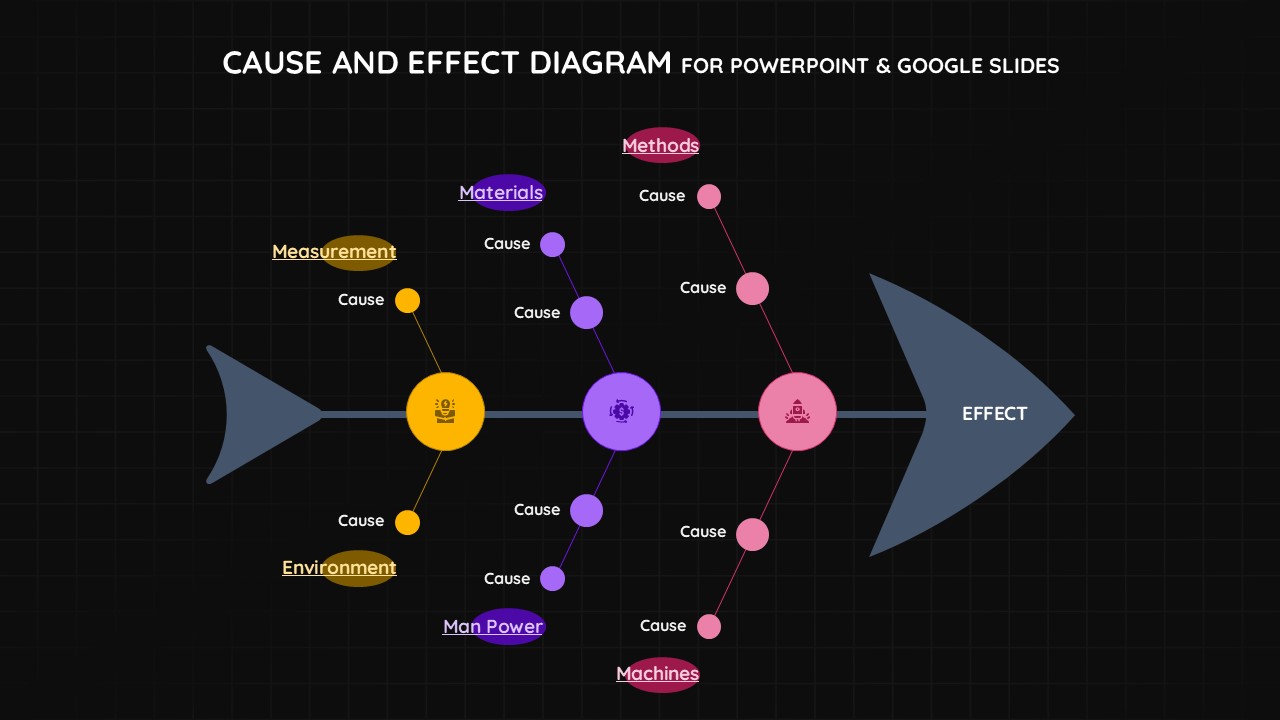
This Cause And Effect Diagram Template for PowerPoint & Google Slides provides a classic fishbone structure with six main category branches extending from a central spine. The template features a color-coded system using orange, purple, and pink themes to distinguish between different cause categories including Methods, Materials, Measurement, Environment, Man Power, and Machines. Each branch includes sub-cause nodes for detailed analysis, presented in both light and dark theme variants with professional flat design aesthetics.
This Cause And Effect Diagram Template for PowerPoint & Google Slides is ideal for quality management professionals, Six Sigma practitioners, and business analysts conducting root cause analysis. Perfect for problem-solving workshops, process improvement initiatives, team meetings, and training sessions where systematic cause identification is essential. The template supports various methodologies including Lean manufacturing, quality control processes, and strategic business troubleshooting across multiple industries and organizational contexts.
Fully customizable text placeholders allow easy modification of cause categories and sub-causes to match specific analysis requirements. The dual-theme design ensures versatility across different presentation environments and corporate branding needs. This template streamlines complex problem-solving processes while maintaining visual clarity and professional presentation standards.
Features of this Cause and Effect Diagram template
• Classic fishbone diagram layout with six main category branches
• Color-coded system for easy cause categorization and organization
• Light and dark theme variants for different presentation environments
• Professional flat design with circular nodes and clean lines
• Fully editable text placeholders for complete customization
Why use this template
• Streamlines root cause analysis and problem-solving processes
• Enhances visual communication of complex cause-effect relationships
• Supports Six Sigma and Lean manufacturing methodologies
• Provides professional framework for quality management presentations
Who is it for
This template is designed for quality managers, Six Sigma practitioners, business analysts, process improvement specialists, operations managers, project managers, consultants, and training professionals who need to conduct systematic root cause analysis and present problem-solving frameworks in corporate, manufacturing, or educational settings.
Login to download this file


