


Thermometer Graphic PowerPoint & Google Slides Templates

Thermometer Graphic Template
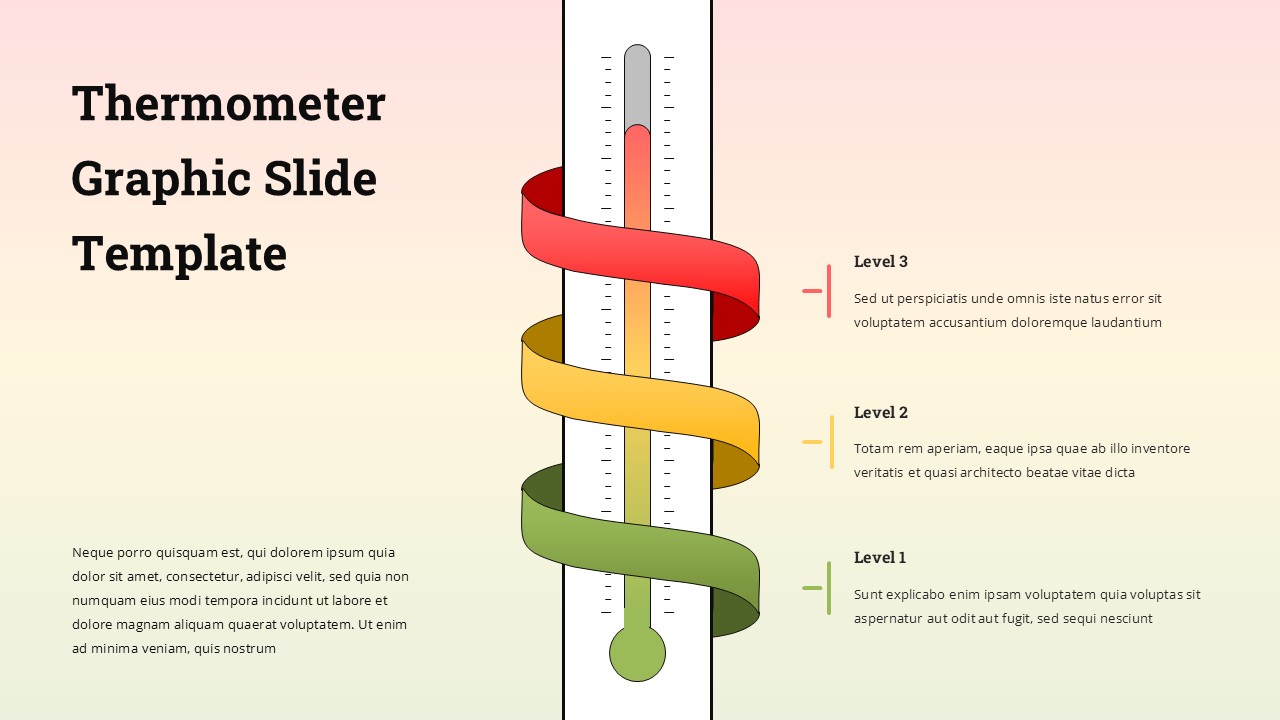
The Thermometer Graphic Template for PowerPoint and Google Slides is a premium 3D visualization tool engineered for business professionals, project managers, and analysts to effectively communicate progress, performance metrics, and goal achievement. Featuring a sophisticated three-level color-coded system (red, yellow, and green), this template simplifies complex data such as sales targets, risk assessments, or quality control benchmarks—into a clear and engaging visual hierarchy. With its clean layout and dual-theme options, including both light and dark gradient variants, the design ensures professional credibility across diverse presentation environments. Fully customizable to match specific brand requirements, the template provides a modern, 16:9 optimized solution for anyone needing to present measurable milestones or hierarchical data with high visual impact.
Features of this Thermometer Graphic template
3D Thermometer Illustration: A central, high-impact graphic featuring a three-level color-coded system for intuitive data classification.
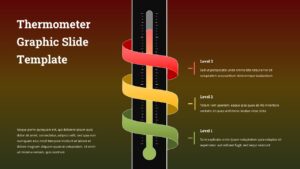
Dual Background Variants: Professional slide options available in both light and dark gradient themes to adapt to different lighting and presentation styles.
Optimized Visual Hierarchy: Clean, organized layout with left-aligned titles and right-side content areas for maximum scannability.
Complete Customization: Fully editable text placeholders and color schemes, allowing for seamless integration with corporate branding.
Widescreen Format: Designed in a 16:9 aspect ratio, perfectly optimized for modern high-definition displays and projectors.
Login to download this file


