


Sankey Chart PowerPoint & Google Slides Templates


Sankey Chart Template
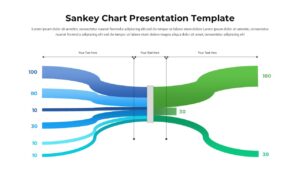
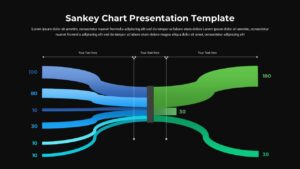
This Sankey Chart Template for PowerPoint & Google Slides provides a sophisticated visual framework for displaying data flow and process transformations. Features clean, modern design with blue-to-green gradient flows, numerical value labels, and customizable annotation points. The template includes both light and dark theme variants, with smooth curved flow lines connecting input and output stages through intermediate processing nodes for maximum clarity and professional presentation.
This Sankey Chart Template for ppt & Slides is ideal for business analysts, project managers, data scientists, and operations teams who need to visualize complex workflows, resource allocation, or conversion processes. Perfect for presenting financial flows, energy distribution, customer journey mapping, manufacturing processes, budget tracking, lead qualification funnels, and sustainability reporting scenarios where understanding flow relationships is critical for decision-making.
The template offers complete editability with customizable text placeholders, adjustable numerical values, and flexible color schemes. Both light and dark theme options ensure versatility across different presentation environments. Easy-to-modify annotation labels and flow paths allow quick adaptation to specific data sets and business contexts.
Features of this Sankey Chart Template
• Dual theme options (light and dark backgrounds) for versatile presentation environments
• Professional blue-to-green gradient color scheme with high contrast readability
• Fully customizable numerical values and flow path labels
• Clean annotation points with editable text placeholders
• Modern design with smooth curved flow lines and clear visual hierarchy
Why use this Sankey Chart Template
• Simplifies complex data flow visualization for better audience comprehension
• Saves design time with professional pre-formatted Sankey diagram structure
• Enhances presentation impact through clear visual process mapping
• Adapts easily to various industries and data presentation needs
Who is it for
This template is perfect for business analysts, data scientists, project managers, operations managers, financial analysts, sustainability coordinators, marketing professionals, and consultants who need to present workflow analysis, resource allocation, conversion tracking, energy distribution, budget flows, or process optimization data in executive presentations, client reports, or strategic planning sessions.
Login to download this file


