


Ishikawa Diagram PowerPoint & Google Slides Templates
Ishikawa Diagram Template Slide
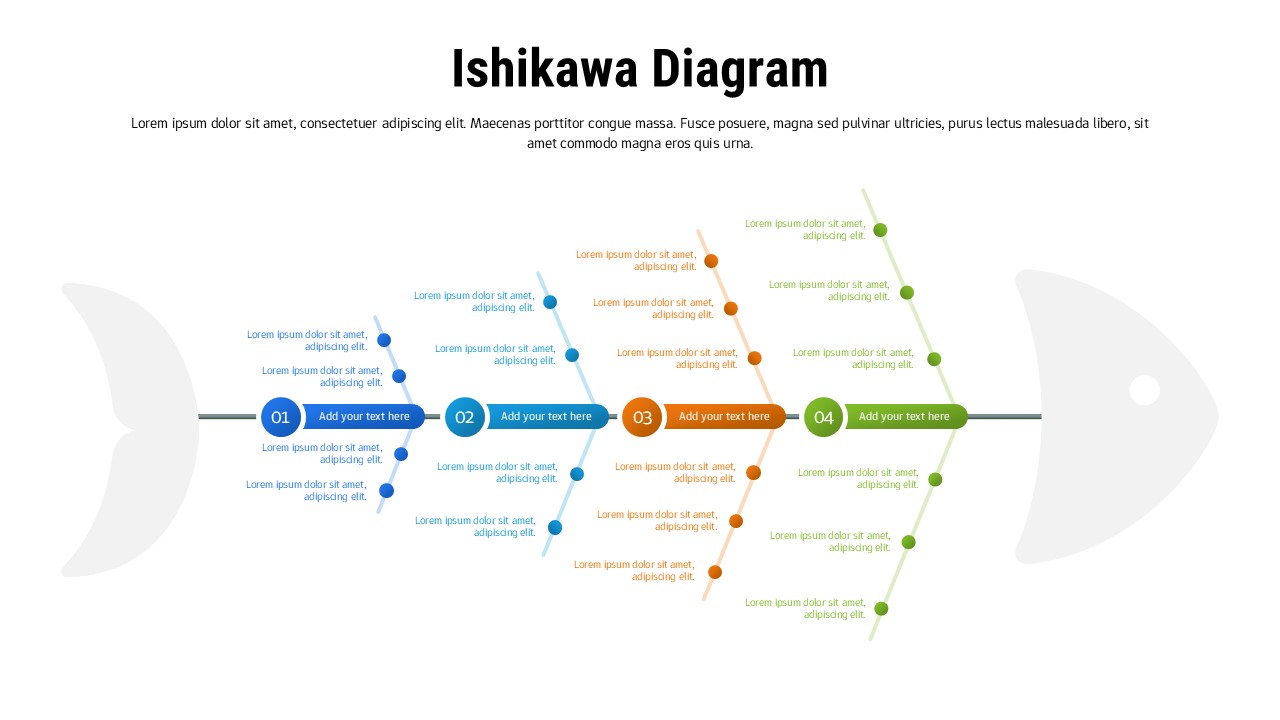
Getting to the root of a problem is rarely straightforward. Teams meet, theories get thrown around, and somewhere between the whiteboard and the boardroom, the real cause gets lost. This Ishikawa Diagram Template for PowerPoint & Google Slides makes sure that never happens — giving you a structured, visual framework that traces every problem back to its source clearly, systematically, and professionally.
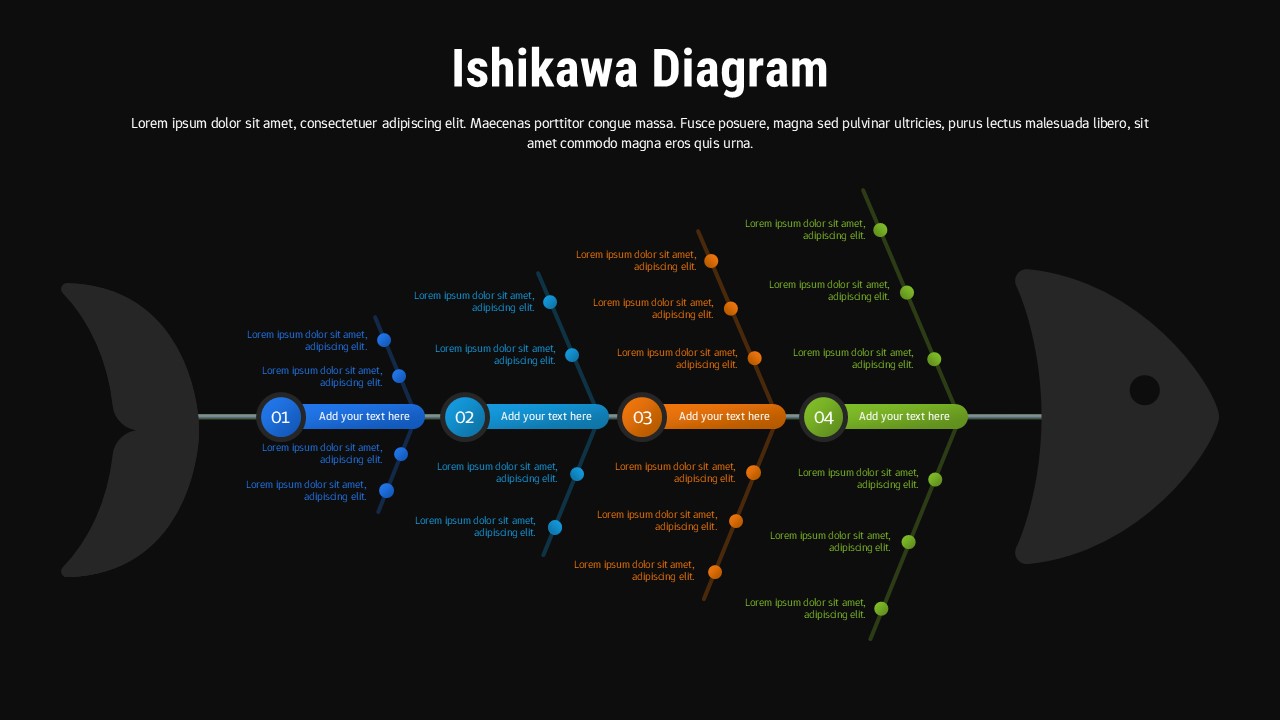
Built around the classic fishbone structure, the template features four color-coded branches in blue, teal, orange, and green, each supporting multiple layers of causes and subcauses. Numbered sections keep the analysis organised and easy to follow, while the clean central spine ties everything together into one coherent visual. Whether you’re presenting to a leadership team or running a hands-on workshop, the layout communicates complex findings in a way that any audience can follow and act on immediately.
Two theme variants light and dark mean the template fits naturally into any presentation environment without looking out of place. Every element is fully editable, so you can adjust colors, replace placeholder text, and restructure branches to match your specific process, industry, or analytical needs. No design experience required.
In practice, this template works best for Six Sigma projects, lean manufacturing reviews, service quality assessments, continuous improvement workshops, and operational troubleshooting sessions anywhere structured cause-and-effect analysis is part of the work.
Features
Four color-coded branches with full cause and subcause hierarchy
Light and dark theme variants included
Numbered sections for organised visual flow
Fully editable colors, text, and structure
Who It’s For
Designed for quality managers, Six Sigma practitioners, manufacturing engineers, operations managers, process improvement specialists, and consultants who need to map root causes, lead structured analysis sessions, and present complex findings with clarity and confidence.
Login to download this file


