


Octopus Diagram PowerPoint & Google Slides Templates

Octopus Diagram Template
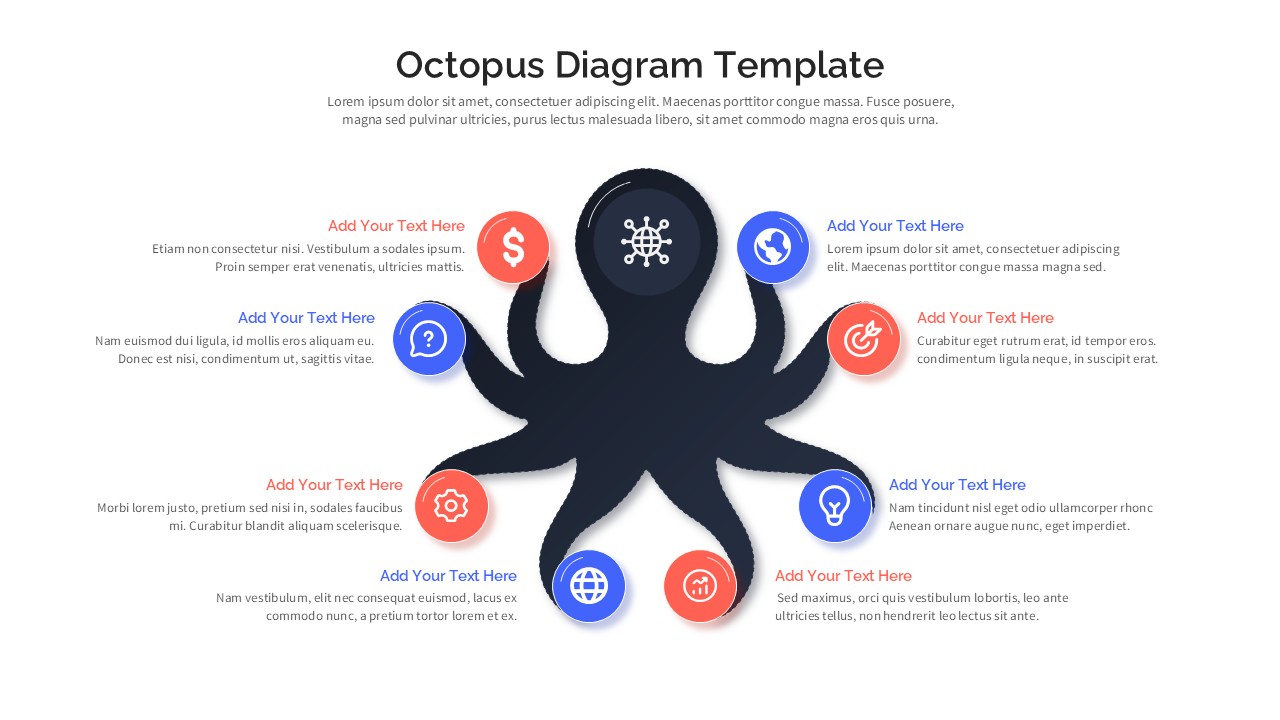
Tired of linear bullet points that fail to show how your ideas connect? This Octopus Diagram for PowerPoint and Google Slides offers a refreshing, organic alternative. Built around a central “hub” with eight radiating “spoke” tentacles, it’s the perfect visual for any concept where multiple elements support a single core objective.
Why the “Octopus” Design Works
Humans are naturally wired to understand centralized systems. By using an octopus silhouette, this template creates an immediate mental anchor for your audience.
Equal Priority: Unlike a vertical list, the radial layout suggests that all eight points are of equal importance.
Logical Contrast: The alternating coral and electric blue nodes provide an instant visual rhythm, helping the eye navigate the data without fatigue.
Professional Versatility: Every icon is a vector shape—swap the default globe or lightbulb for your own brand-specific symbols in seconds.
Optimized for the Modern Boardroom
This isn’t just about looking good; it’s about functional performance in high-stakes environments.
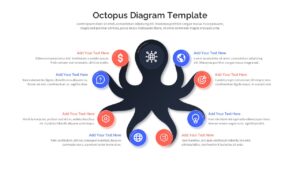
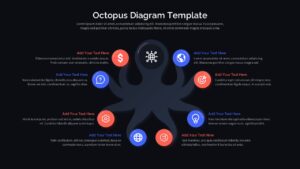
Dark & Light Modes: Choose the high-contrast dark theme for digital screens or the clean light theme for handouts and bright conference rooms.
16:9 Widescreen: Built natively for modern presentation displays to ensure zero distortion or letterboxing.
Full Editability: Change colors, font sizes, and tentacle curves to match your corporate identity directly within your preferred software.
Ideal For:
| Professional | Use Case |
| Strategy Analysts | Mapping out an 8-factor SWOT analysis or competitive landscape. |
| Project Managers | Visualizing cross-functional team structures or project milestones. |
| Marketers | Breaking down 8-channel digital ecosystems (SEO, Social, Email, etc.). |
| Educators | Categorizing complex theories into digestible, interconnected sub-topics. |
Login to download this file


