




Creative Research Concept Map Template for PowerPoint & Google Slides
Network Style Hub and Spoke Diagram Model Concept Map Template
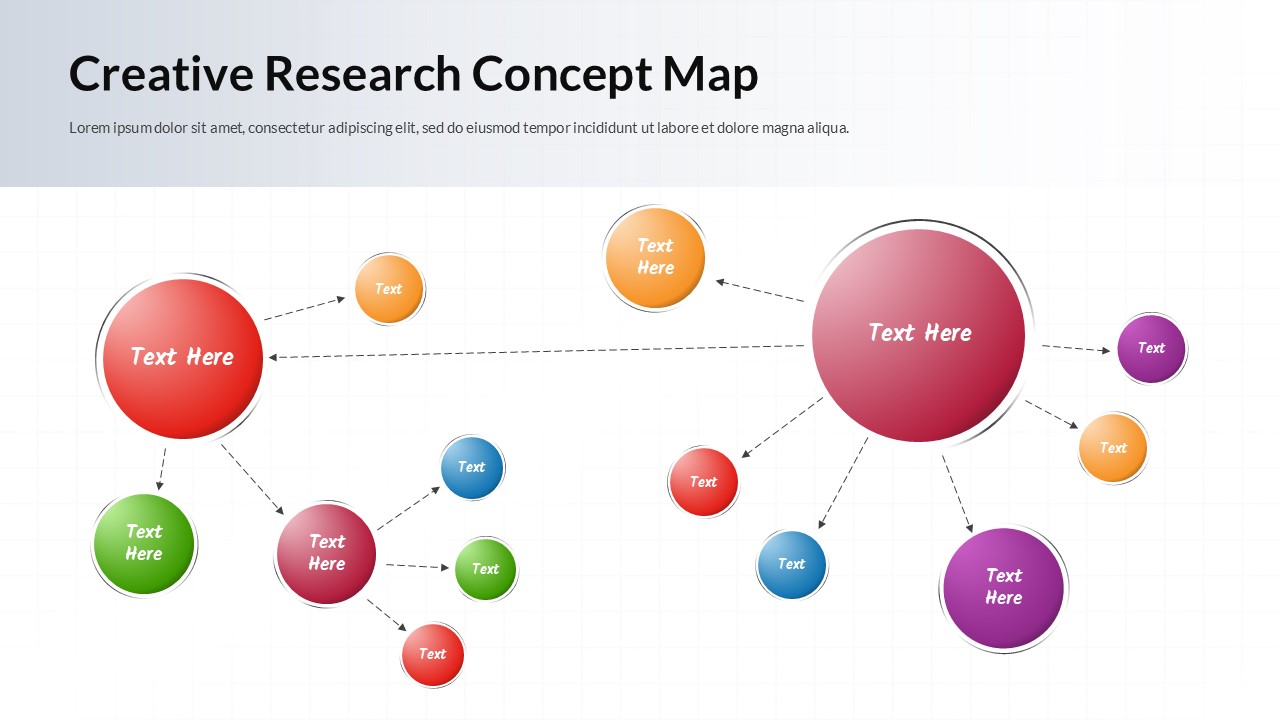
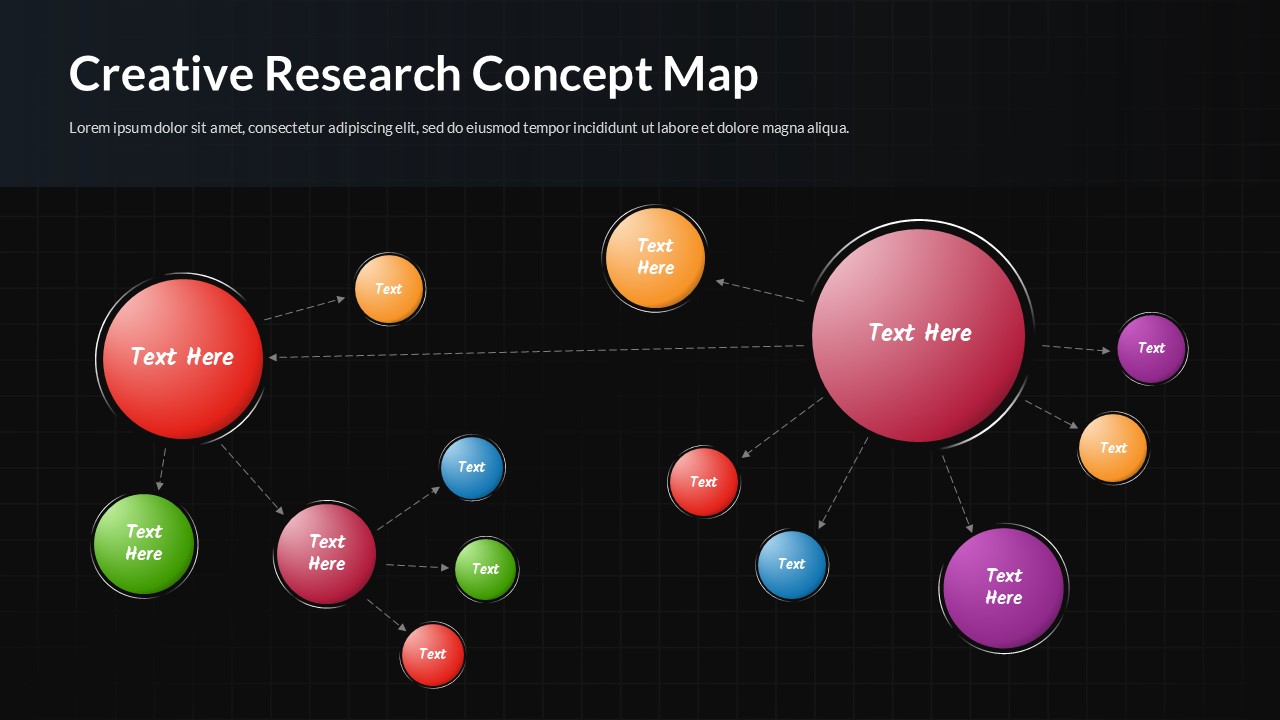
This Creative Research Concept Map offers a non-linear framework for connecting multiple ideas across a single digital canvas. It is designed specifically for academic researchers and strategic planners who need to show how primary theories branch into specific sub-points during a high-stakes presentation. The varied node sizes establish an immediate visual hierarchy that distinguishes main hubs from satellite data, ensuring that your audience understands the weight of each individual concept. This layout ensures your core findings remain centered while peripheral ideas are neatly linked via dotted directional arrows. The use of vibrant gradients helps each node stand out against the subtle grid background, which aids in maintaining a professional and organized aesthetic.
The file contains two primary hub nodes and eleven satellite nodes, providing a total of thirteen editable zones for your data. Each circular element is a vector shape, meaning you can resize or recolour them without any loss of quality. The dotted lines act as logical connectors that you can drag and drop to redefine the relationships between your research points. Because it is a 16 by 9 aspect ratio, it fills modern screens perfectly, making it a reliable choice for both remote webinars and large conference halls.
This tool works best during a thesis defense where complex literature reviews must be visualized as an interconnected web rather than a static list. It is also an ideal fit for strategic brainstorming sessions where a team needs to map out market influences or product dependencies in real time. Project managers often reach for this format when illustrating the ripple effects of a single decision across multiple departments. By using this research concept map for PowerPoint and Google Slides, you save hours of manual alignment time, allowing you to focus entirely on the quality of your scientific or corporate narrative.
Login to download this file


