




Product Development Roadmap PowerPoint & Google Slides Templates
Product Development Roadmap Template design
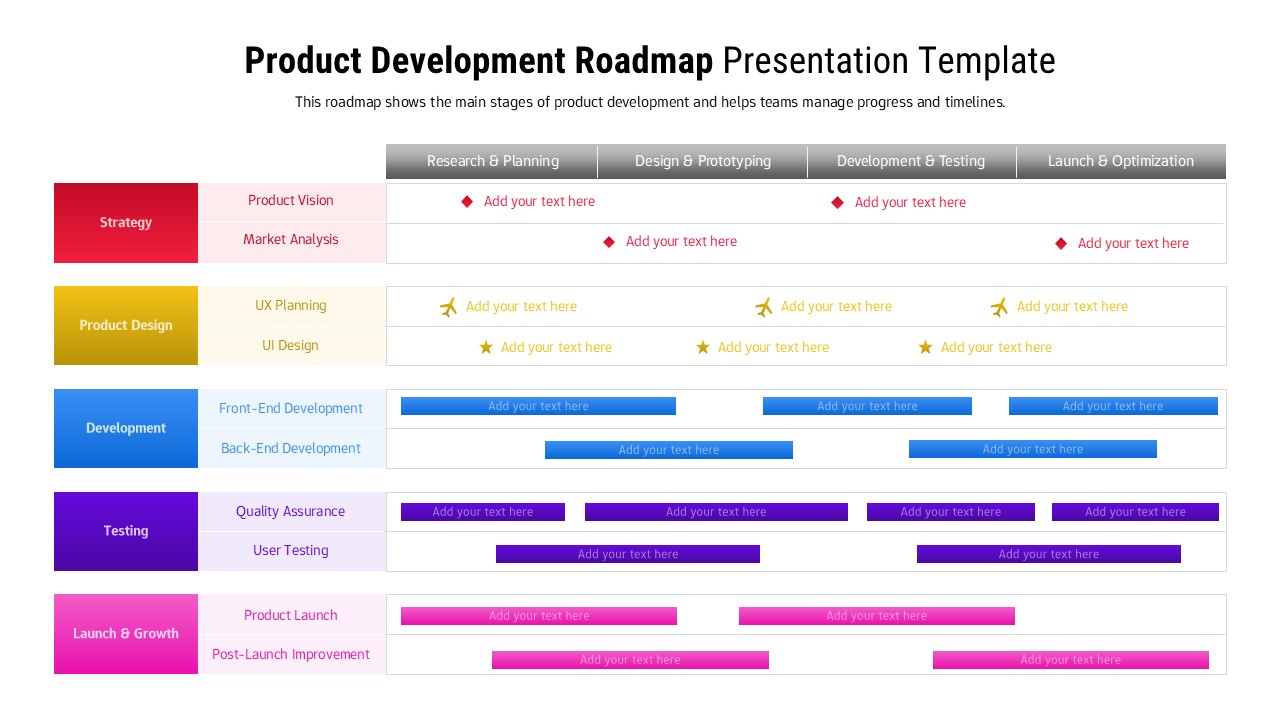
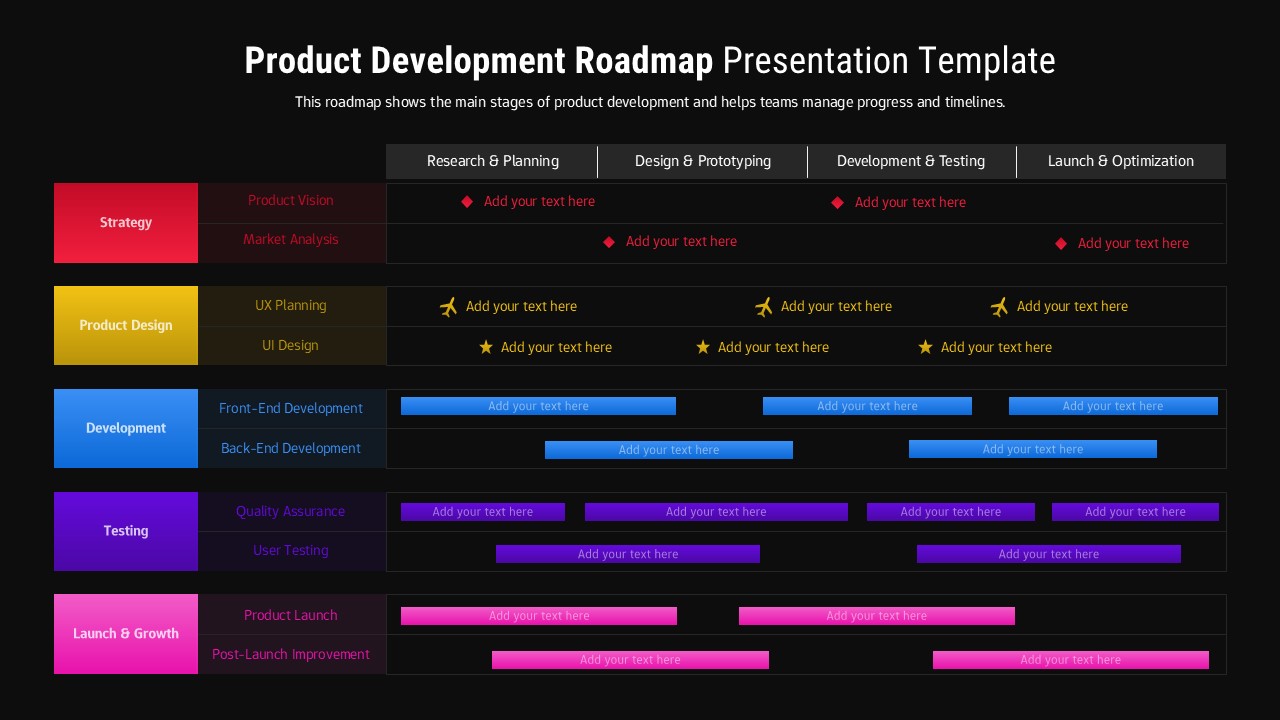
Keeping a product development team aligned across multiple workstreams, timelines, and deliverables is one of the most challenging parts of bringing a product to life. This Product Development Roadmap Template for PowerPoint & Google Slides solves that challenge by presenting your entire development lifecycle in a single, structured Gantt chart-style grid that every stakeholder from engineers to executives can read and understand at a glance. The template organizes the roadmap across four horizontal phases Research & Planning, Design & Prototyping, Development & Testing, and Launch & Optimization and breaks the work down vertically across five color-coded functional areas: Strategy in red, Product Design in gold, Development in blue, Testing in purple, and Launch & Growth in pink.
Each functional area contains two specific workstreams. Strategy covers Product Vision and Market Analysis. Product Design handles UX Planning and UI Design. Development tracks Front-End and Back-End Development. Testing monitors Quality Assurance and User Testing. Launch & Growth manages Product Launch and Post-Launch Improvement. Color-coded milestone markers and horizontal progress bars sit inside each phase cell, giving teams a precise picture of what is happening, when it is scheduled, and how each workstream overlaps with others across the full development timeline.
How to Use the Product Development Roadmap Template
Step 1 — Update the Phase Columns Replace the four default phase headers Research & Planning, Design & Prototyping, Development & Testing, and Launch & Optimization — with your actual project phases and adjust the column widths to reflect the real duration of each stage in your development schedule.
Step 2 — Fill In Each Workstream Row Click on each text placeholder inside the grid cells and replace the default content with your actual tasks, milestones, and deliverable descriptions. Work row by row across Strategy, Product Design, Development, Testing, and Launch & Growth to build out the full picture of your project timeline.
Step 3 — Adjust the Timeline Bars Resize and reposition the color-coded progress bars within each cell to accurately represent the start point, duration, and end date of each task. Move the milestone markers to highlight key review checkpoints, delivery dates, and launch targets across the roadmap.
Step 4 — Customize Colors if Needed The five functional areas use red, gold, blue, purple, and pink as default colors. To align with your brand or team color preferences, select any bar or label element and update the fill color through the Format Shape panel in PowerPoint or the Fill Color option in Google Slides. Apply changes consistently across each row for a clean and professional result.
Step 5 — Save and Share Once your roadmap is complete, export the file as a PDF for stakeholder sharing or printing, save it as a PPTX for live presentations, or use the Google Slides share link for real-time collaboration and remote team access from any device.
Login to download this file


