


Blank Bar Graph PowerPoint & Google Slides Templates

Blank Bar Graph Template
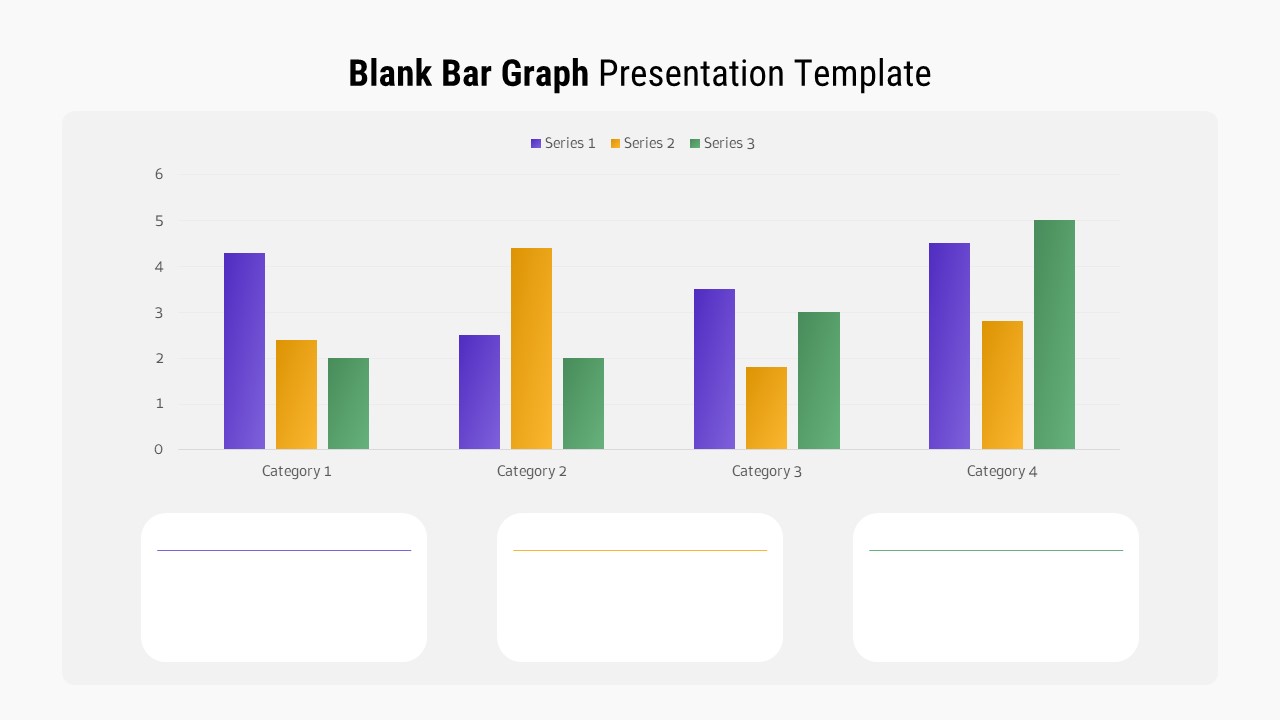
Building a data slide from zero takes time most presenters do not have. This blank bar graph template for PowerPoint and Google Slides eliminates that problem entirely by delivering a complete, presentation ready empty bar chart template straight out of the box. Open it, add your numbers and walk into the room ready.
Everything in Its Right Place
This blank graph template is organized around one core principle, making data comparison effortless for the person looking at the screen. Three clearly separated data series in purple, orange, and green run across four category placeholders inside a grouped bar chart that communicates structure before a single number is entered. A built in legend removes any guesswork from the visual, and three content boxes sitting beneath the chart give you the space to contextualize, clarify and convert your data into something an audience can act on. Every section of this unfilled bar chart template exists for a reason and nothing is there by accident.
Designed to Travel Well
Not every presentation happens in the same room under the same conditions. This editable bar graph template was built with that reality in mind, offering both a light and a dark background version so the slide looks deliberate and polished regardless of the environment. The 16:9 aspect ratio means this bare bar chart framework displays with full sharpness on any modern screen, from a compact laptop to a wide format conference display, without any manual resizing or reformatting.
Flexibility Without the Friction
Customizing this blank column graph template requires no design experience and no extra tools. Relabel the category placeholders to reflect your data set, key in your figures, adjust the color scheme to align with your brand guidelines and rewrite the content boxes to carry your specific message. The template absorbs every change while keeping the overall layout clean, balanced and professional, making it just as effective for internal team reviews as it is for high stakes external presentations.
Key Features
- Clean grouped bar chart with three distinctly color coded data series, four adaptable category placeholders, and a self contained legend that makes this blank bar chart template instantly interpretable by any audience
- Full light and dark background versions included so this empty bar chart template remains visually consistent and professionally appropriate across every presentation setting and display condition
- Three structured content boxes beneath the chart that elevate this bare graph layout beyond a simple visual and into a complete, insight driven presentation asset
Who It’s For
- Corporate analysts, finance leads, and business strategists who need a dependable blank bar graph template for communicating performance data, budget comparisons, and growth metrics with clarity and professionalism
- Digital marketers, research analysts, and brand managers who rely on an empty graph template to present audience data, campaign benchmarks, and market findings in a format that resonates with stakeholders at every level
- Professors, operations leads, project coordinators, and independent consultants who need a versatile bare bar chart framework that handles multi category comparisons cleanly and consistently across a wide range of subjects and presentation contexts
Login to download this file


