




People Process Technology Venn Diagram PowerPoint Templates

People Process Technology Venn Diagram
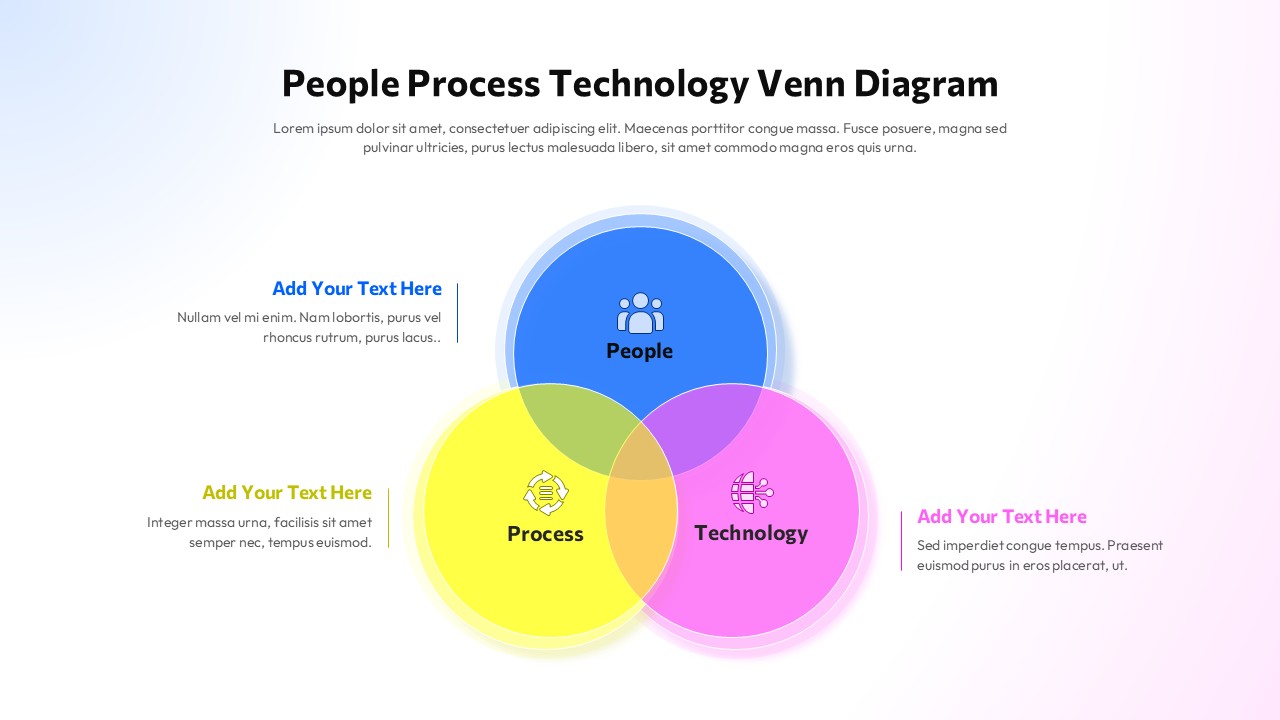
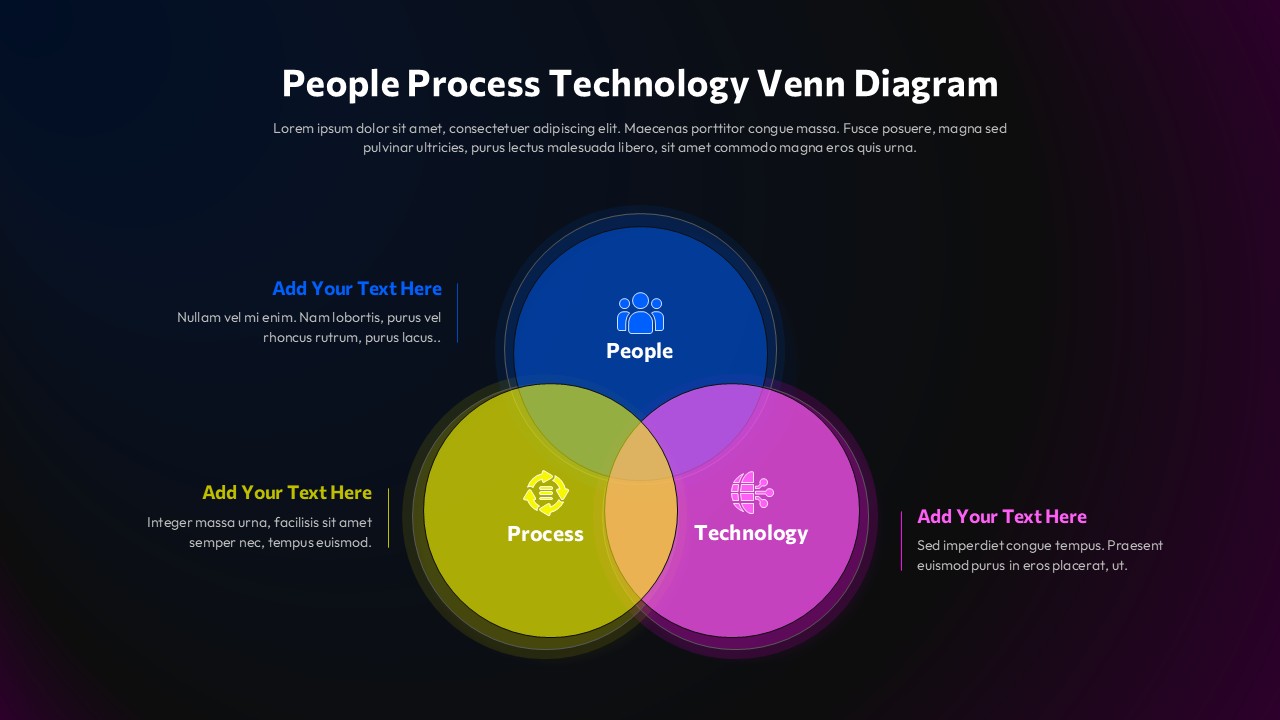
If you’ve ever tried to explain how people, process, and technology work together in an organization, you know it’s a lot easier to show than to say. That’s exactly what this People Process Technology Venn Diagram is built for. It takes three overlapping circles, one for people, one for process, and one for technology, and lays them out so your audience can instantly see where each element connects, and where the real magic happens in that middle overlap.
What makes this People Process Technology Venn Diagram so useful is how flexible it is. Whether you’re presenting a digital transformation strategy, walking through an organizational change plan, or explaining IT governance to a room full of stakeholders, the layout adapts to fit your message. Each circle comes with its own labeled space, so you can drop in your own definitions, examples, or supporting text without having to rebuild the diagram from scratch.
Consultants, project managers, and business strategists reach for a People Process Technology Venn Diagram constantly because it’s one of the clearest ways to show interdependency. People rely on process to get things done consistently, process relies on technology to scale, and technology only works well when people actually use it right. This template captures all of that in a single, easy to read visual instead of three separate bullet points that never quite land the same way.
Download the People Process Technology Venn Diagram for PowerPoint
Built for PowerPoint, this People Process Technology Venn Diagram works seamlessly with your existing animations, transitions, and formatting tools. It also opens cleanly in Google Slides if that’s your preferred platform. Every circle, label, and color can be edited to match your branding or your specific framework, so it never feels like a generic, one-size-fits-all diagram.
Login to download this file


