


Product Life Cycle Curve Diagram Template for PowerPoint & Google Slides

Product Life Cycle Stages Presentation Template
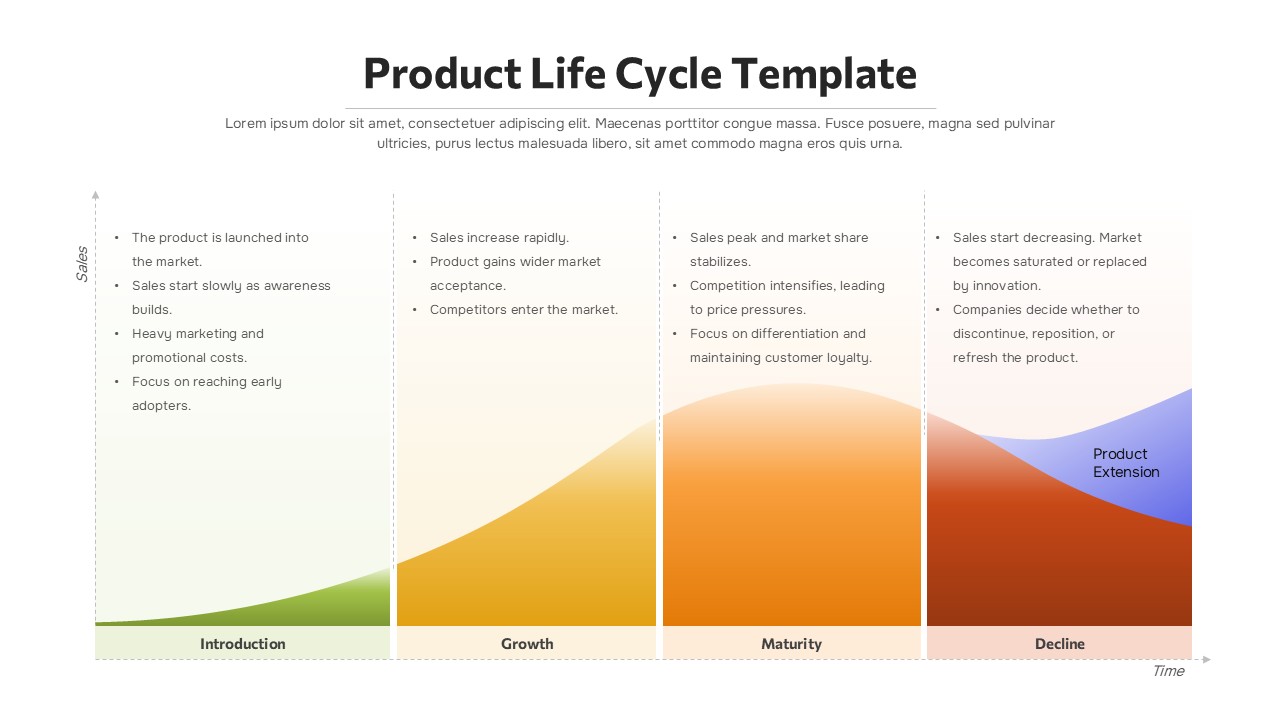
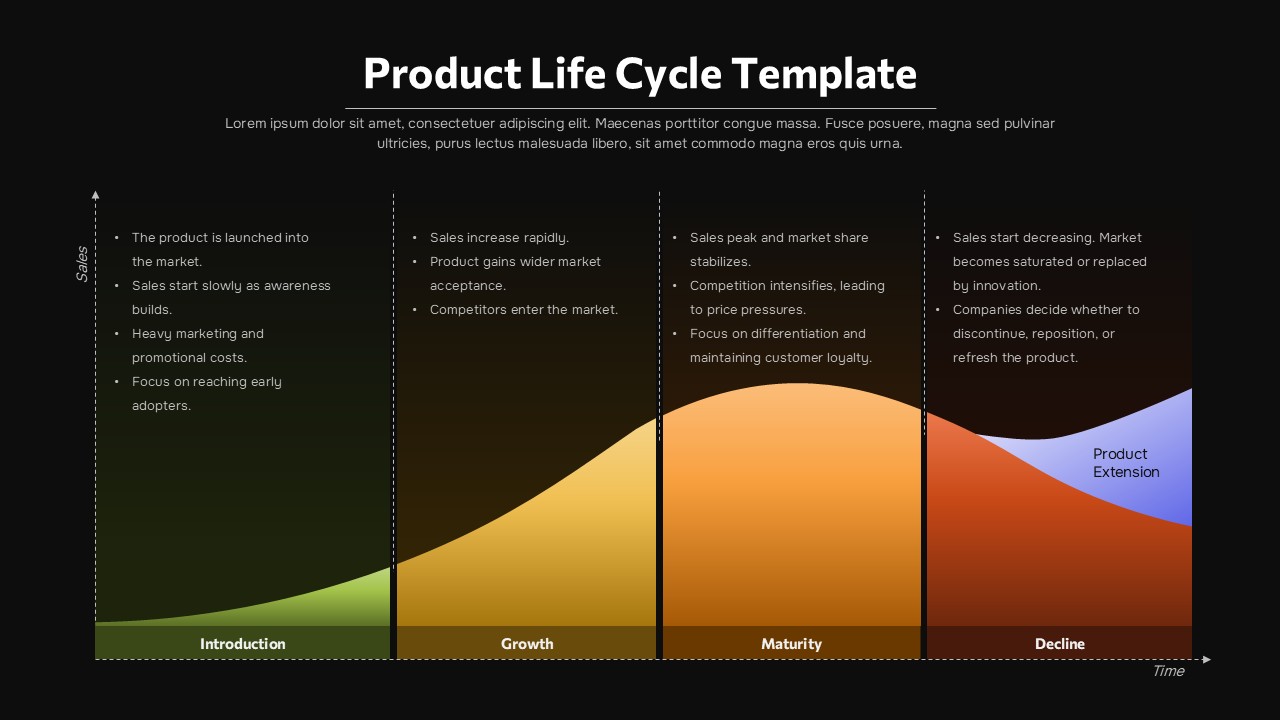
This Product Life Cycle Curve Diagram Template for PowerPoint & Google Slides provides a clear, structured visual framework for illustrating how a product progresses through its core market stages: Introduction, Growth, Maturity, and Decline. Designed with soft gradient backgrounds and a smooth rising-and-falling curve, the slide visually communicates variations in sales performance over time while keeping the information clean and easy to interpret. Each stage includes concise bullet-point descriptions that highlight key market behaviors, competitive conditions, and strategic focus areas.
The visual curve transitions from green in the introduction phase to yellow during growth, orange at maturity, and a mix of red-blue tones in the decline stage, where “Product Extension” is also illustrated. This Product Life Cycle Curve Diagram Template is ideal for marketers, business strategists, and product managers looking to explain market evolution, evaluate performance, or guide launch and optimization decisions. Optimized for both PowerPoint and Google Slides, it ensures effortless editing, polished visuals, and seamless integration into broader presentations. Whether used in training, strategic planning, or pitch decks, the Product Life Cycle Curve Diagram Template helps teams align on product health, plan innovation, and make data-driven decisions with confidence.
Features of this Product Life Cycle Diagram template
• Four clearly divided product life cycle stages with descriptive bullet points.
• Smooth gradient curve visually representing sales progression over time.
• Editable text, colors, and layout for full customization in both PowerPoint and Google Slides.
• Clean professional structure suitable for strategic discussions and business reviews.
• Visual indicator for extended product strategies during decline.
Why use this Product Life Cycle Diagram template
• Communicates complex product life cycle concepts in a simple, intuitive format.
• Enhances strategic planning, forecasting, and product performance assessments.
• Helps teams visualize growth opportunities, competitive pressures, and timing for innovation.
• Saves preparation time while maintaining a polished, executive-friendly design.
Who is it for
Product managers, marketing teams, strategists, consultants, educators, and business leaders presenting product evolution insights or planning market strategies.
Login to download this file


