


4 Way Venn Diagram PowerPoint & Google Slides Templates
4 Way Venn Diagram Presentation Templates
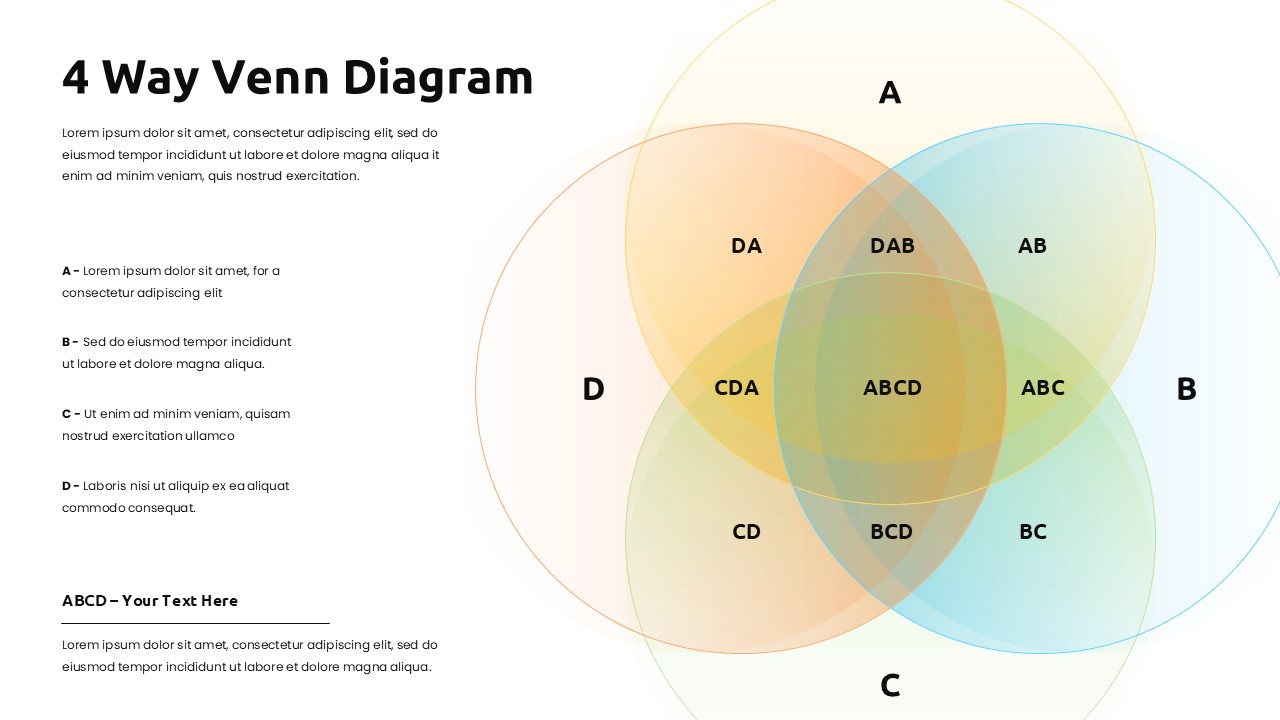
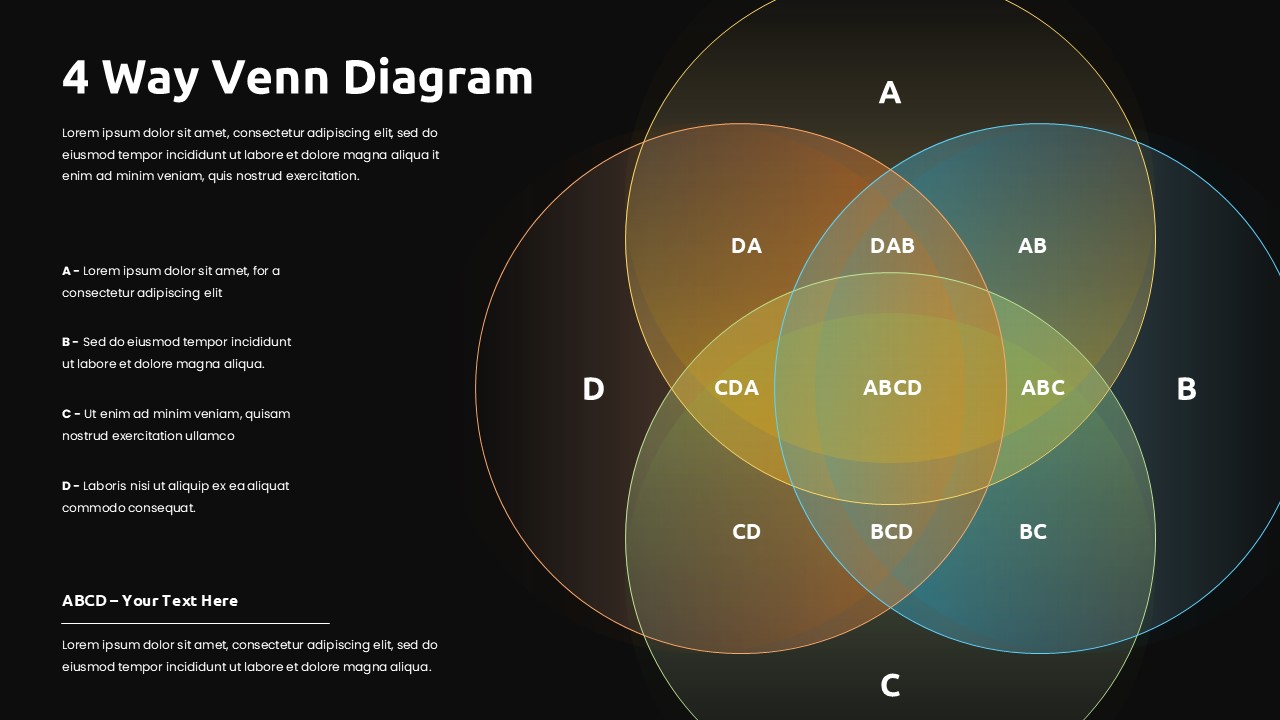
This 4 Way Venn Diagram Template for PowerPoint & Google Slides provides four overlapping circles labeled A, B, C, and D, creating 15 distinct regions that showcase all possible intersections between multiple data sets. The template features a clean layout with translucent colors, professional typography, and dedicated text areas for detailed descriptions of each category and their overlapping relationships. Both light and dark theme variants are included to match various presentation environments and branding requirements.
This 4 Way Venn Diagram Template for PowerPoint & Google Slides is ideal for business analysts, researchers, project managers, and strategists who need to visualize complex relationships between four different variables or categories. Perfect for market analysis, competitive comparisons, stakeholder mapping, resource allocation planning, and academic presentations requiring detailed set theory visualization. The template supports comprehensive data analysis where understanding overlaps and unique attributes across multiple dimensions is crucial for decision-making.
The template offers complete editability with customizable colors, fonts, and text content to align with your brand guidelines and presentation requirements. Each section includes placeholder text that can be easily replaced with your specific data, making it simple to create professional visualizations that clearly communicate complex relationships and drive informed discussions with stakeholders.
Features of this template
• Four overlapping circles creating 15 distinct intersection regions
• Light and dark theme variants for versatile presentation environments
• Professional color scheme with translucent overlapping effects
• Dedicated text areas for detailed category descriptions
• Fully customizable colors, fonts, and content placeholders
Why use this template
• Visualize complex relationships between four variables or data sets
• Create professional presentations for strategic analysis and planning
• Save time with pre-designed layouts and professional formatting
• Enhance audience understanding of multi-dimensional data comparisons
Who is it for
This template is perfect for business analysts, market researchers, project managers, consultants, academic professionals, data scientists, and strategic planners who need to present complex relationships between multiple variables, conduct comparative analysis, or visualize overlapping categories in business, research, or educational settings.
Login to download this file


