


Concentric Market Segmentation Circles Template for PowerPoint & Google Slides
This template is part of a deck featuring multiple slides. To check out all slides.
See AllProduct Description
Nested Circular Levels Infographic Presentation Template
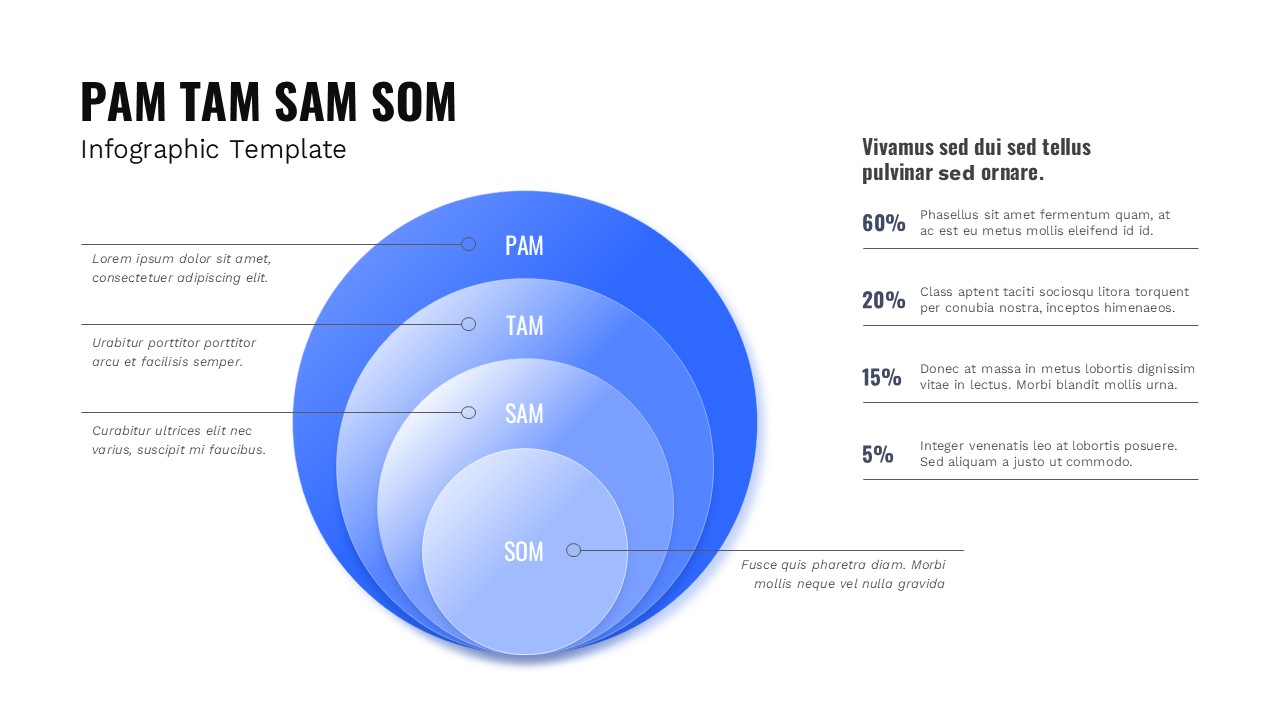
Present complex ideas with clarity using this concentric circle layered infographic template designed for PowerPoint & Google Slides. Built around four nested circular layers labeled PAM, TAM, SAM, and SOM, this concentric circle layered infographic template visually represents market segmentation, strategic scope, or hierarchical breakdowns in a structured and engaging format. The gradient blue rings create a sense of depth and progression, helping audiences instantly grasp relationships between total market potential and more refined target segments.
Each circle is connected to clean side callouts, allowing you to add detailed explanations without cluttering the core visual. On the right side, percentage indicators (60%, 20%, 15%, 5%) provide a clear quantitative breakdown, making this layout ideal for market analysis, investment presentations, or strategic planning sessions. The balanced composition, subtle shadows, and modern typography ensure a polished, executive-ready appearance that works seamlessly across business, startup, and consulting environments. Fully editable shapes, text placeholders, and colors allow you to adapt the concentric circle layered infographic template to different industries, data sets, or branding guidelines. Whether you’re explaining total addressable market metrics or illustrating layered concepts, this slide turns complex data into a compelling visual narrative.
Features of this template
• Four concentric circular layers (PAM, TAM, SAM, SOM) for structured market segmentation.
• Integrated percentage breakdown section for clear quantitative insights.
• Side callout text areas connected with subtle pointer lines.
• Fully editable shapes, fonts, colors, and labels.
• Clean gradient design with depth-enhancing shadows.
Why use this template
• Simplifies complex market data into a clear visual hierarchy.
• Enhances investor and stakeholder understanding during presentations.
• Saves time with ready-made, logically structured layout.
• Delivers a professional, modern look suitable for executive settings.
Who is it for
Startup founders, product managers, marketing strategists, and business consultants presenting market opportunity analysis. Ideal for pitch decks, growth strategy sessions, competitive landscape reviews, and financial forecasting discussions. Also valuable for corporate teams outlining expansion plans, segmentation strategies, or revenue projections in boardroom presentations.
Login to download this file