


Editable Pie Chart PowerPoint & Google Slides Templates

Editable Pie Chart Presentation Template
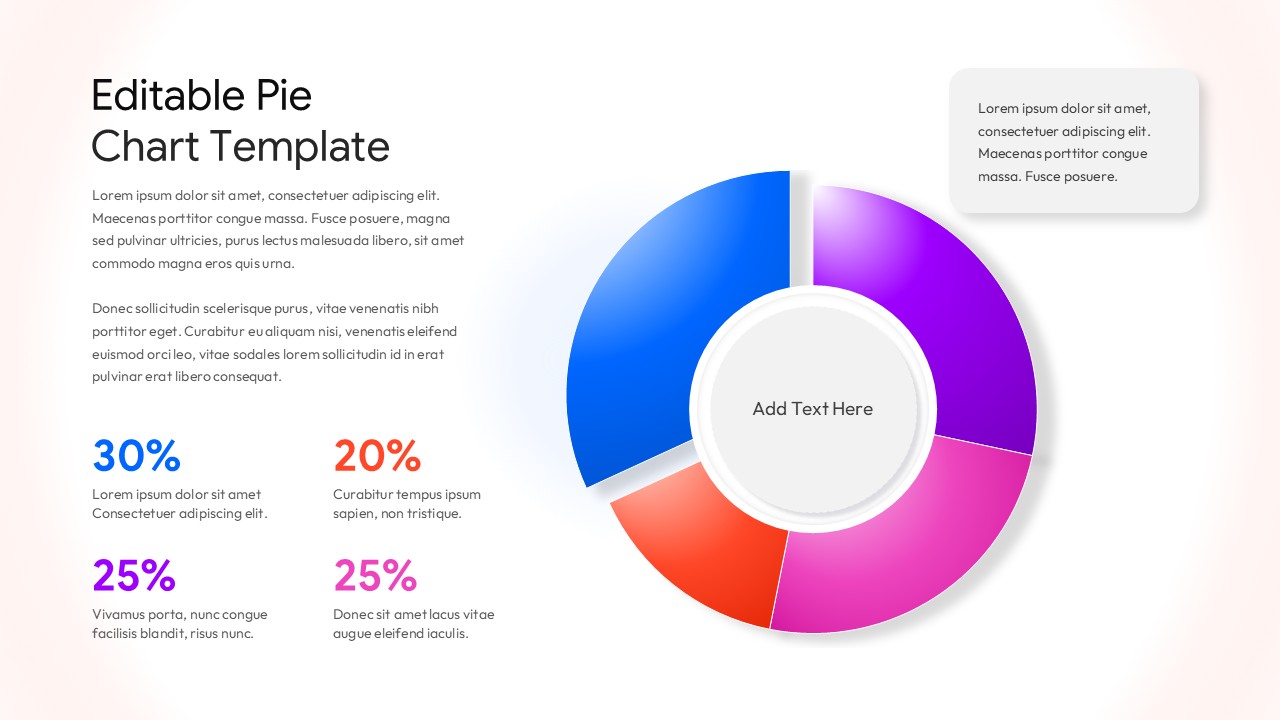
Presenting data clearly is often the difference between a meeting that drags on and one that leads to its intended conclusion. This Editable Pie Chart Template for PowerPoint & Google Slides provides a clean, modern design featuring a prominent donut-style chart with vibrant color segments in blue, purple, coral, and pink. As seen the layout includes statistical callouts arranged in a 2×2 grid alongside descriptive text sections, creating a well-balanced composition that avoids cluttered visuals. Available in both light and dark theme variants, this template offers professional aesthetics with subtle shadows and flat design elements that enhance visual appeal while ensuring your data remains the focal point.
Optimized for Clarity and Customization
This template offers complete customization flexibility, allowing you to modify percentages, colors, text content, and chart segments to match specific data requirements and brand guidelines. It is ideal for business analysts, marketing managers, and financial professionals who need to present data-driven insights like market share analysis, budget allocations, or performance metrics effectively. By simplifying complex data into a clear visual hierarchy, the layout saves significant design time and maintains professional standards across different presentation environments. Whether for executive dashboards or academic research, these dual-theme options ensure your data visualization remains impactful and accessible to any audience.
Login to download this file


