


Euler Diagram PowerPoint & Google Slides Templates


Euler Diagram for Showing Relationships Clearly
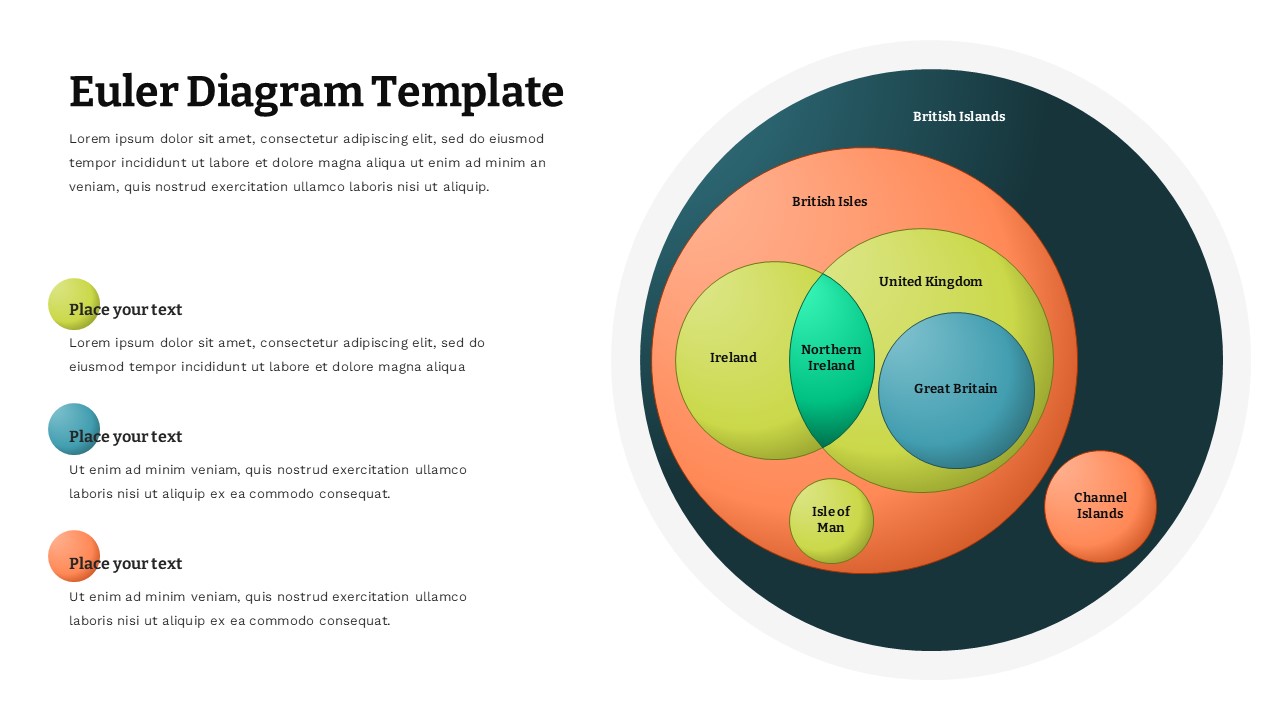
This Euler Diagram template is a simple way to show how different ideas or groups connect with each other. Instead of explaining everything with long text, the overlapping circles help people quickly see what’s related and where things fit.
The slide is laid out in a clean and easy way, with space for your explanation on the left and the diagram on the right. This makes it easier to present your points while the visual supports what you’re saying. The colors also help separate each section, so nothing feels confusing or cluttered.
You can use this template for things like comparisons, categories, or any situation where there’s some overlap between ideas. It works well for teaching, presentations, or even quick discussions where you want to keep things clear.
Everything is easy to edit, so you can change the text, adjust the circles, or update the colors based on your needs. It’s a simple, no-stress way to explain relationships without overcomplicating things.
Features of this Euler Diagram template
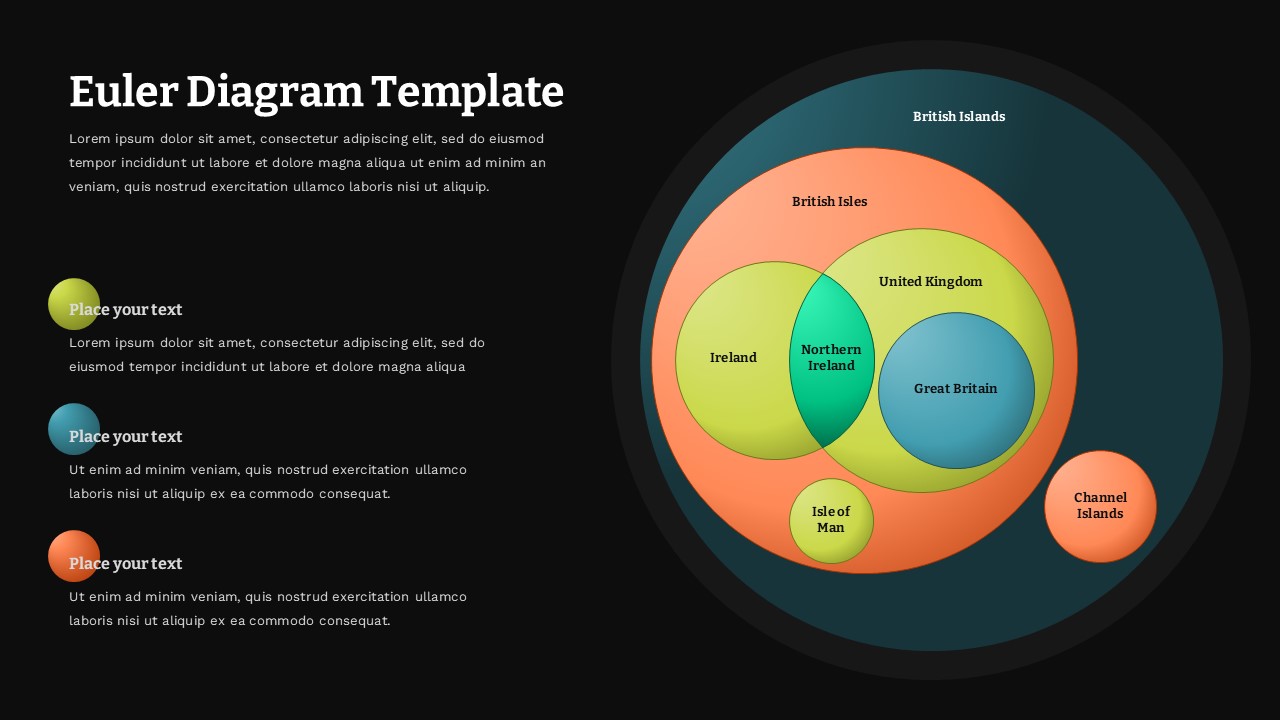
• Dual theme options with light and dark background variants
• Professional two-column layout with balanced text and diagram sections
• Vibrant color-coded circular elements for clear visual distinction
• Fully customizable nested diagram structure for complex relationships
• High-contrast design ensuring excellent readability in any environment
Why use this Euler Diagram template
• Simplifies complex relationship visualization with intuitive circular design
• Saves time with pre-designed professional layouts and color schemes
• Enhances audience understanding through clear visual representation
• Provides flexibility with dual background options for various presentation settings
Who is it for
This template is perfect for educators and academics teaching set theory or logical concepts, business analysts and strategists presenting market relationships and organizational structures, data scientists visualizing categorical overlaps, researchers demonstrating hierarchical relationships, and consultants explaining complex interconnected systems to clients.
Login to download this file


