


Haiti Regional Data Map Presentation Template for PowerPoint & Google Slides
This template is part of a deck featuring multiple slides. To check out all slides.
See AllProduct Description
Haiti Geographic Data Map Presentation Template
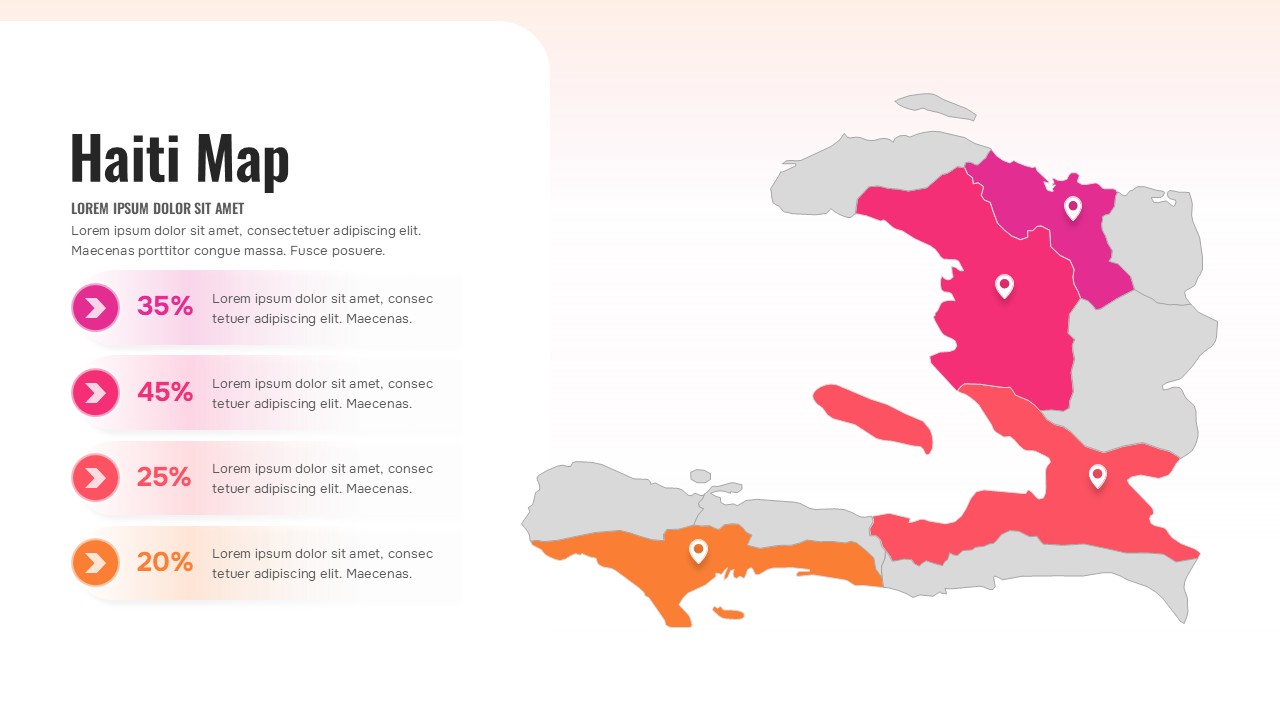
Present geographic insights with clarity using this Haiti Regional Map Infographic Presentation Template for PowerPoint & Google Slides. This visually engaging Haiti map slide highlights multiple regions in distinct colors, allowing you to emphasize regional data, performance metrics, or strategic focus areas with precision. Each highlighted area is paired with a location pin marker, reinforcing geographic context while guiding audience attention to key provinces or departments.
On the left side, percentage-based data blocks with circular arrow icons provide a structured way to showcase statistics such as growth rates, market share, project progress, or demographic distribution. The balanced composition—map visualization on one side and supporting data points on the other—makes this Haiti Regional Map Infographic Presentation Template ideal for storytelling in business, education, and government settings. The soft gradient background and clean typography enhance readability while maintaining a modern, professional appearance.
Fully editable in both PowerPoint and Google Slides, this Haiti Regional Map Infographic Presentation Template allows you to adjust region colors, reposition markers, modify percentage values, and replace placeholder text effortlessly. Whether you are delivering a regional performance review, NGO impact report, tourism analysis, or infrastructure update, this slide ensures your geographic data is presented in a compelling and organized format.
Features of this template
• Color-coded Haiti map with clearly defined regional sections.
• Four percentage data blocks with circular arrow icons for key metrics.
• Location pin markers to highlight specific cities or departments.
• Fully editable shapes, colors, and text placeholders.
• Clean layout optimized for PowerPoint and Google Slides.
Why use this template
• Simplifies complex geographic data into an easy-to-understand visual format.
• Enhances audience engagement with clear regional differentiation.
• Supports data-driven storytelling for reports and briefings.
• Saves time while delivering a polished, professional presentation.
Who is it for
This slide is designed for business analysts, government officials, NGO teams, educators, and consultants presenting region-based insights about Haiti. It is particularly useful for market expansion reports, public sector planning, tourism development strategies, infrastructure updates, and demographic analysis. Marketing teams, investment professionals, and project managers can also use this map slide to visualize territory performance, operational coverage, or regional growth comparisons in a structured and impactful way.
Login to download this file