


Black harvey-balls-feature-comparison-powerpoint-
This template is part of a deck featuring multiple slides. To check out all slides.
See All
Product Description
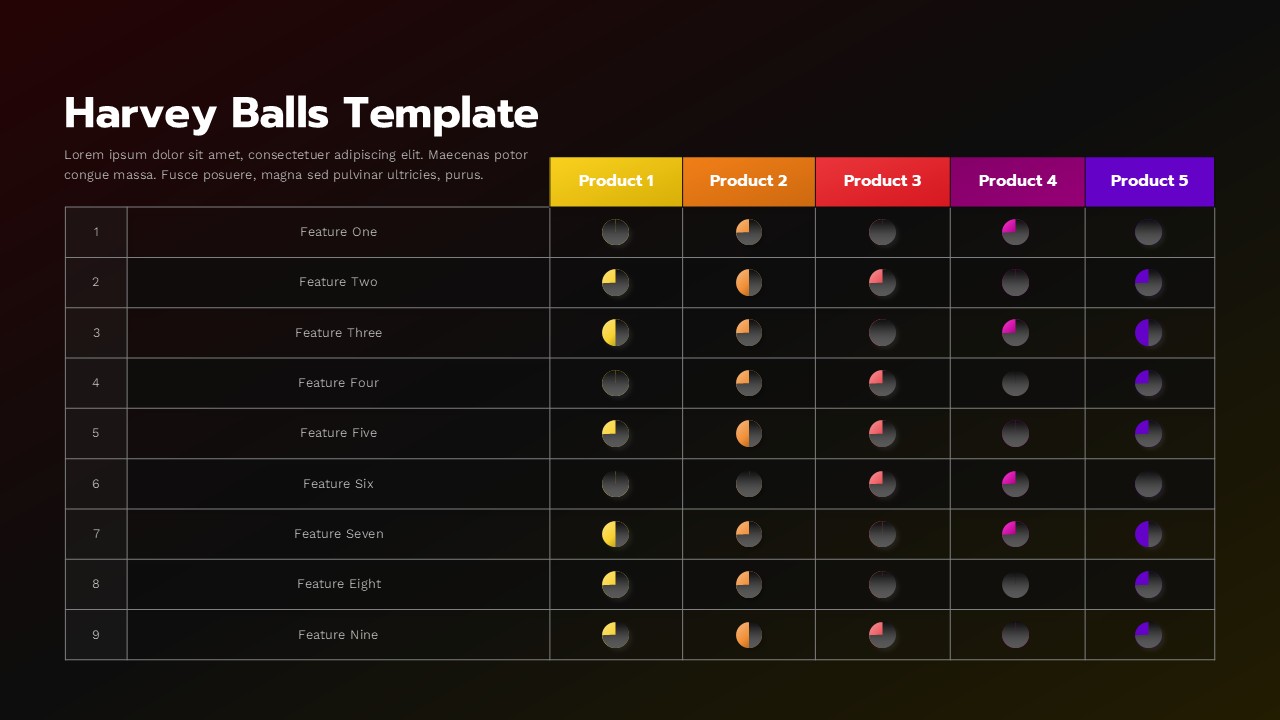
Harvey Balls Product Comparison Matrix Presentation Template
This Harvey Balls feature comparison table template is designed to help you visually compare multiple products, services, or options across a consistent set of criteria. The slide uses a structured grid layout with rows for features and columns for products, making it easy to evaluate relative strengths at a glance. Each cell contains a Harvey Ball indicator, allowing you to represent qualitative ratings such as low, medium, or high performance without relying on dense text or numbers. This Harvey Balls feature comparison table template is ideal for decision-making scenarios where clarity and speed of understanding are critical.
The layout combines clean typography with color-coded column headers to differentiate products clearly while keeping the overall design balanced and professional. Circular Harvey Balls are evenly spaced and aligned, ensuring visual consistency across all rows. The neutral background and subtle grid lines help maintain focus on the data, while the color accents guide the viewer’s eye across comparisons. All elements are fully editable in PowerPoint and Google Slides, enabling you to customize labels, colors, and rating levels to fit your specific context.
Whether you are comparing software features, vendor capabilities, project options, or strategic alternatives, this template supports structured analysis and confident communication. The scalable table format allows you to add or remove rows and columns without disrupting alignment. By translating complex evaluations into simple visual signals, this Harvey Balls feature comparison table template helps stakeholders quickly grasp differences, identify patterns, and reach informed conclusions during presentations or reviews.
Features of this Harvey Balls comparison table template
• Structured comparison table with rows for features and columns for multiple products.
• Harvey Ball indicators to represent qualitative performance levels visually.
• Color-coded column headers for quick product differentiation.
• Fully editable layout, text, colors, and icons in PowerPoint and Google Slides.
Why use this Harvey Balls comparison table template
• Simplifies complex comparisons into an easy-to-read visual format.
• Enhances clarity and decision-making in meetings and presentations.
• Saves time by providing a ready-made, professional comparison structure.
• Improves audience engagement with intuitive visual rating symbols.
Who is it for
This template is ideal for product managers, consultants, sales teams, analysts, and executives who need to compare options side by side. It is also useful for business strategists, procurement teams, and educators presenting qualitative evaluations, feature analyses, or decision frameworks.
Login to download this file