


Black Mississippi State US County Map Infographic Template for PowerPoint & Google Slides
This template is part of a deck featuring multiple slides. To check out all slides.
See All
Product Description
Mississippi USA State Map Presentation Template
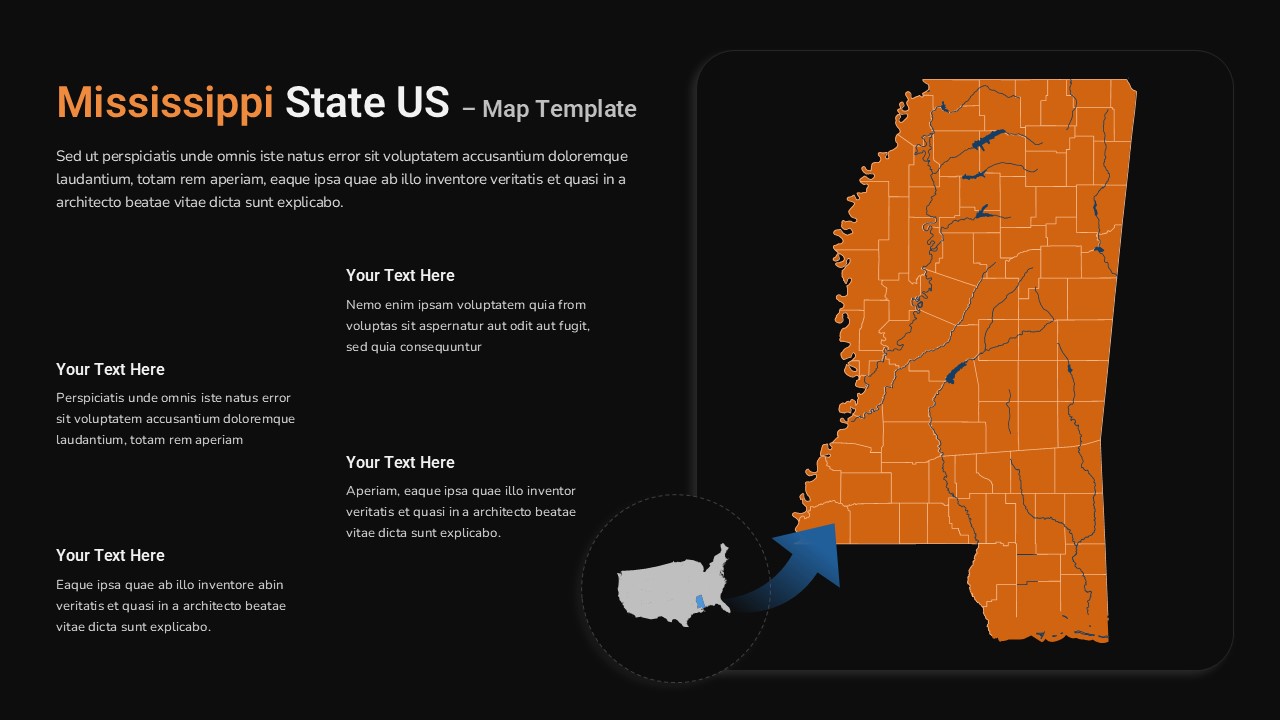
Present geographic data with clarity using this Mississippi State US Map Infographic Template for PowerPoint & Google Slides. Designed around a detailed county-level map of Mississippi, this slide highlights state boundaries, internal county divisions, and major river paths in a bold orange layout. The right side features a large, vertically oriented Mississippi map, while the left side provides structured text placeholders for key insights, statistics, or regional commentary. A small U.S. locator map with an arrow visually reinforces Mississippi’s national context, making this Mississippi State US Map Infographic Template ideal for reports that require geographic precision and visual hierarchy.
The clean composition ensures your audience immediately focuses on the state map while easily scanning supporting content. With editable text blocks and scalable vector graphics, you can customize colors, labels, and data points without losing resolution. Whether you're presenting demographic trends, economic development data, infrastructure projects, or educational statistics, this Mississippi State US Map Infographic Template helps you communicate complex regional information in a structured, professional format.
Optimized for both PowerPoint and Google Slides, the layout maintains full visual consistency across devices and screen sizes. Simply update the text areas, emphasize specific counties, or integrate icons and charts to align with your brand or project goals.
Features of this template
• Detailed Mississippi map with county boundaries and river highlights.
• Large right-aligned map layout for strong visual impact.
• Multiple structured text placeholders for insights and data points.
• Integrated U.S. locator map with directional arrow for context.
• Fully editable vector shapes and text for easy customization.
Why use this template
• Showcase state-level data in a clear, visually engaging format.
• Improve geographic storytelling in reports and briefings.
• Save time with a ready-to-edit county map structure.
• Enhance professional presentations with a modern infographic layout.
Who is it for
This slide is ideal for government agencies, educators, researchers, consultants, and business analysts presenting Mississippi-focused data. It is also suitable for economic development teams, healthcare planners, infrastructure project managers, and marketing professionals conducting regional analysis. Use it in strategic briefings, public policy discussions, academic lectures, sales territory planning, or investment presentations requiring clear state-level visualization.
Login to download this file