


Black Net Promoter Score NPS Dashboard Infographic Template for PowerPoint
This template is part of a deck featuring multiple slides. To check out all slides.
See All
Product Description
Customer Net Promoter Score NPS Analysis Presentation Template
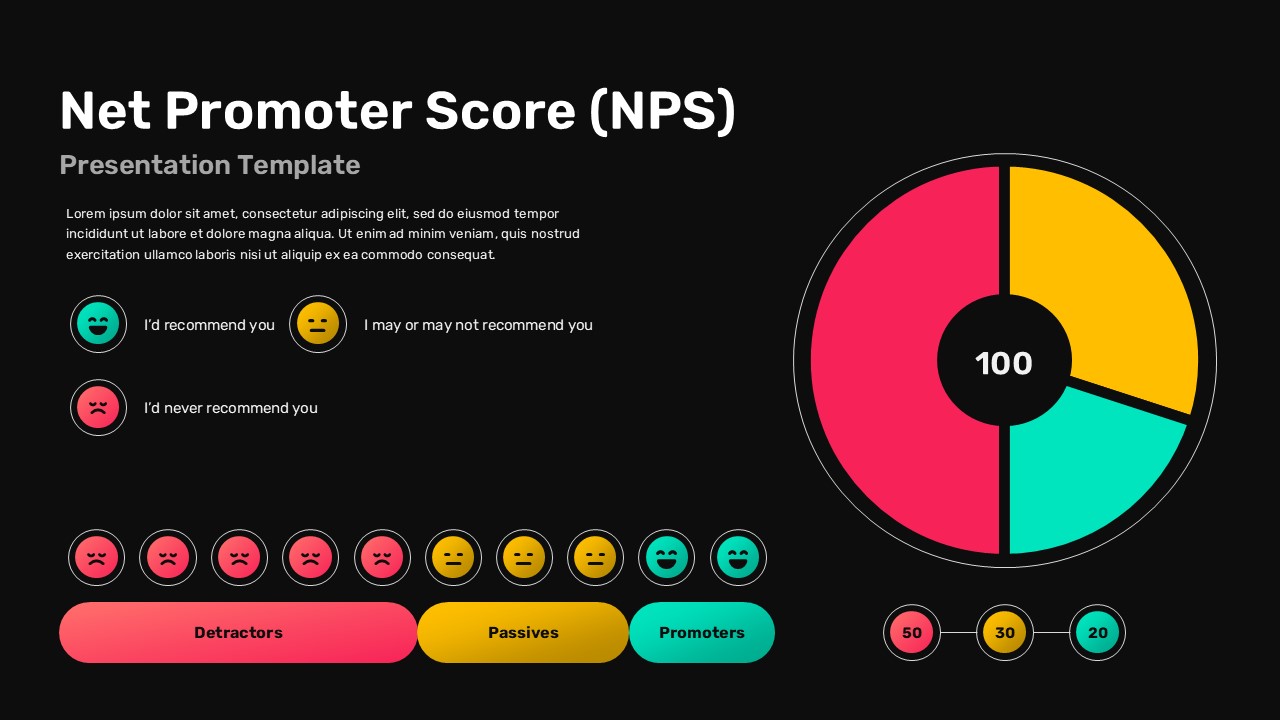
This Net Promoter Score NPS dashboard infographic is designed to clearly visualize customer loyalty and satisfaction in a single, compelling slide. The layout combines a bold donut chart with intuitive emotive icons to categorize respondents into promoters, passives, and detractors. Each segment is color-coded for instant recognition, allowing audiences to quickly understand overall performance and sentiment distribution. With the NPS score highlighted at the center, this NPS dashboard makes key metrics immediately visible and presentation-ready.
The template is fully editable in PowerPoint and Google Slides, enabling teams to adjust values, colors, labels, and icons to reflect real survey data. Supporting elements, such as percentage indicators and response scales, help explain how the score is calculated and interpreted. Whether used in executive reviews, customer experience reports, or stakeholder updates, this Net Promoter Score NPS dashboard transforms raw feedback into a clear visual story that supports data-driven decisions.
Features of this Net Promoter Score template
• Central donut chart emphasizing the overall NPS value.
• Clear visual separation of detractors, passives, and promoters.
• Editable icons, percentages, and labels for accurate reporting.
• Clean dashboard-style layout optimized for presentations.
Why use this template
• Communicates customer loyalty metrics at a glance.
• Enhances reports with a professional, data-focused design.
• Reduces time spent building NPS visuals from scratch.
• Ensures consistency across PowerPoint and Google Slides.
Who is it for
Customer experience managers, marketing teams, product leaders, analysts, and executives tracking customer satisfaction and loyalty trends.
Login to download this file