


Quarterly Performance Bar Chart Dashboard Template for PowerPoint & Google Slides
This template is part of a deck featuring multiple slides. To check out all slides.
See AllProduct Description
Free Quarterly Performance Bar Chart Dashboard Presentation Template
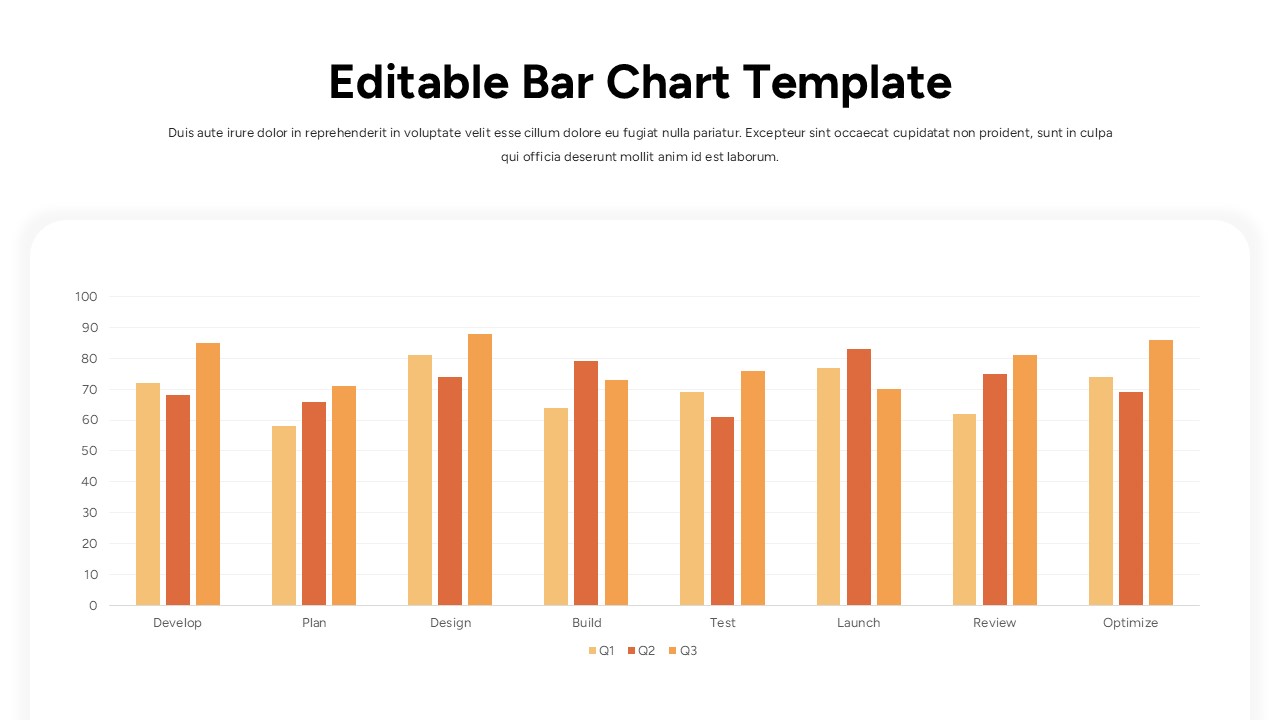
Present your data with clarity using this Free Editable Quarterly Bar Chart Dashboard Template for PowerPoint & Google Slides. Designed around a structured multi-category bar chart, this slide enables you to compare quarterly performance across key project phases such as Develop, Plan, Design, Build, Test, Launch, Review, and Optimize. The grouped vertical bars for Q1, Q2, and Q3 are color-coded for quick visual distinction, while a subtle grid and labeled axis ensure precise data interpretation. This bar chart dashboard template balances simplicity and analytical depth, making it ideal for executive briefings, project reviews, and performance tracking sessions.
The Editable Quarterly Bar Chart Dashboard Template for PowerPoint & Google Slides features a clean layout with a prominent title area, short descriptive subtitle, and a large central chart container with rounded edges. Each bar cluster is evenly spaced to maintain readability, helping audiences instantly compare trends across quarters and categories. Whether you are tracking KPIs, evaluating campaign outcomes, or reviewing operational milestones, this bar chart dashboard template helps transform raw numbers into actionable insights.
Fully customizable, you can adjust values, rename categories, change quarter labels, or adapt the color scheme to match your brand guidelines. Optimized for both PowerPoint and Google Slides, this slide preserves formatting consistency across devices and ensures a polished, professional presentation every time.
Features of this Quarterly Bar Chart Dashboard template
• Grouped vertical bar chart comparing three quarters across multiple stages.
• Clearly labeled horizontal and vertical axes with gridlines for accurate reading.
• Editable title, subtitle, category names, and data values.
• Rounded container layout with modern spacing for visual clarity.
Why use this template
• Simplifies quarterly performance comparisons in one comprehensive view.
• Enhances data storytelling with structured visual hierarchy.
• Saves preparation time with a ready-made, fully editable chart layout.
• Supports KPI tracking, project reviews, and strategic reporting.
Who is it for
Project managers, business analysts, marketing teams, operations leaders, and executives who need to present quarterly performance metrics clearly and professionally. It is also suitable for consultants, startup founders, and corporate teams delivering strategy updates, performance dashboards, or internal review presentations.
Login to download this file