


Free Quarterly Report Dashboard Template for PowerPoint & Google Slides
This template is part of a deck featuring multiple slides. To check out all slides.
See AllProduct Description
Free Quarterly Performance Report Dashboard with Visual Charts Presentation Template
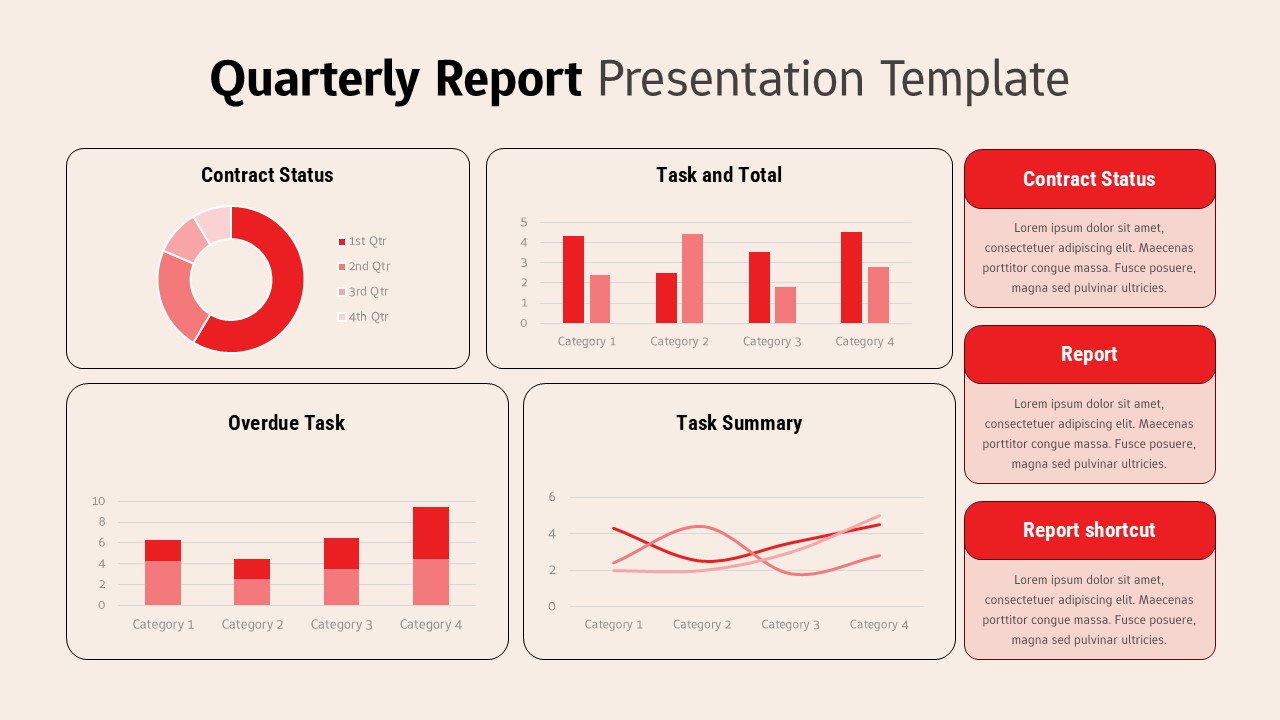
This quarterly business report dashboard is designed to present performance data, progress metrics, and insights in a clear, executive-friendly layout. The slide combines multiple chart types including a donut chart, bar charts, and a line graph into a balanced dashboard structure that supports fast interpretation. Each panel is framed with rounded containers, helping viewers distinguish sections such as contract status, task totals, overdue tasks, and overall task summary. This quarterly business report dashboard enables decision-makers to assess trends, compare categories, and identify risks at a glance.
Built for clarity and consistency, this quarterly business report dashboard uses a neutral background paired with bold red highlights to emphasize key data points. Dedicated side panels allow space for written summaries, contract notes, or report shortcuts, ensuring both quantitative and qualitative insights are communicated together. Fully editable in PowerPoint and Google Slides, the layout supports recurring quarterly updates without redesign effort. Whether used for leadership briefings, stakeholder reviews, or internal reporting, this quarterly business report dashboard transforms complex data into a structured, professional presentation.
Features of this template
• Integrated dashboard layout with multiple chart types on one slide.
• Sections for contract status, task totals, overdue tasks, and summaries.
• Side panels for written insights, highlights, or report notes.
• Clean grid structure with rounded containers for visual clarity.
• Fully editable charts, text, and colors in PowerPoint and Google Slides.
Why use this template
• Communicates quarterly performance clearly and efficiently.
• Reduces reporting time with a ready-made dashboard structure.
• Supports data-driven discussions with visual clarity.
• Maintains a professional look suitable for executive audiences.
Who is it for
This template is ideal for managers, executives, analysts, and project leads preparing quarterly updates. It is well suited for business reviews, operational reporting, stakeholder presentations, and internal performance tracking across departments.
Login to download this file