


Vertical Process Infographics PowerPoint & Google Slides Templates
Vertical Process Infographics
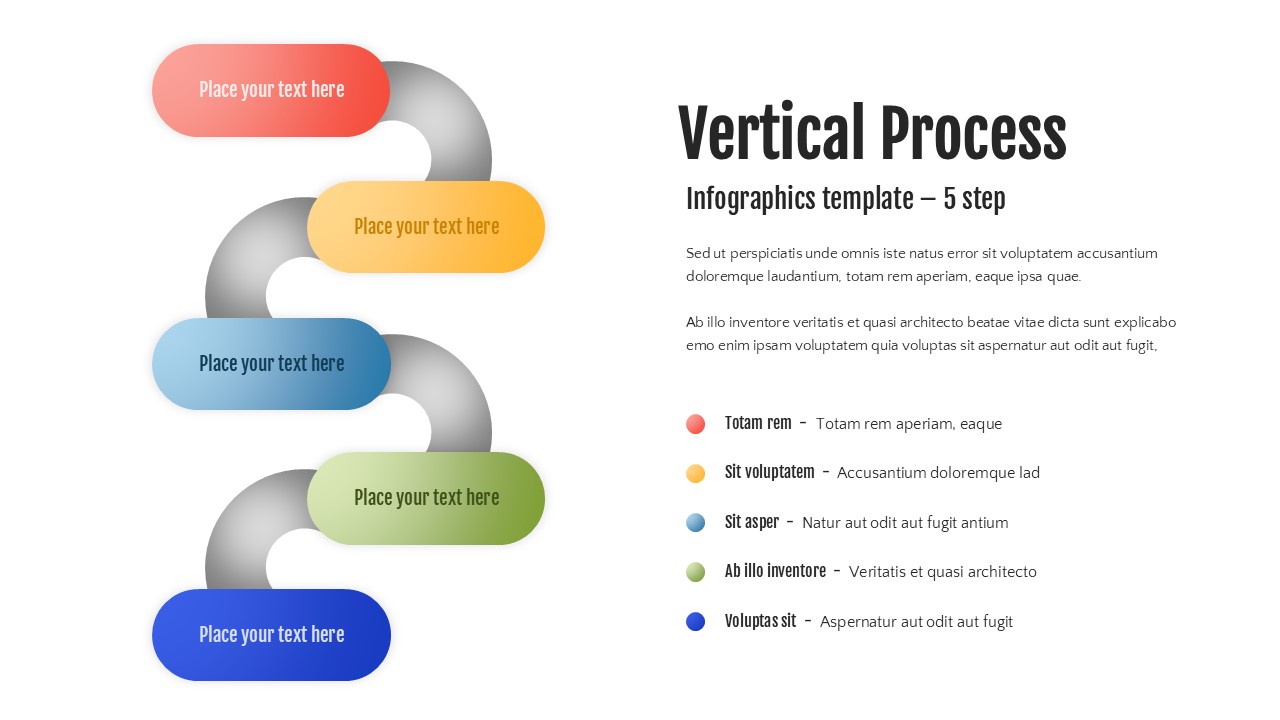
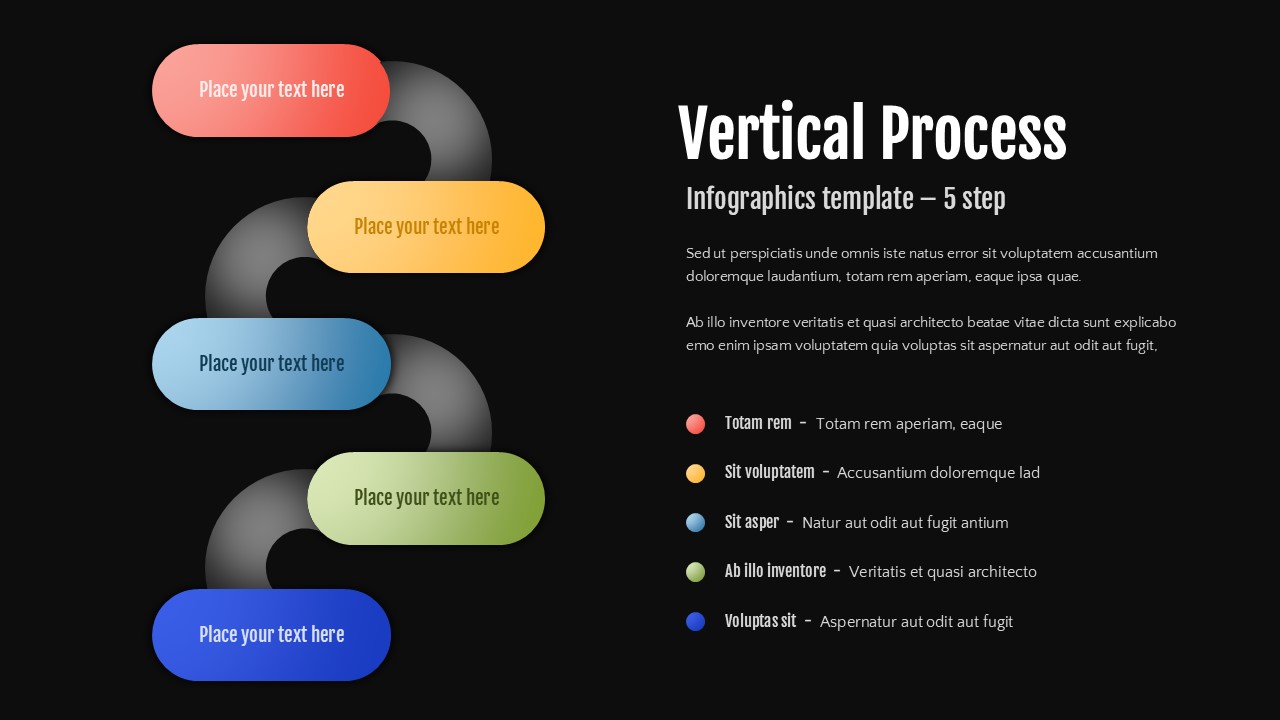
The Vertical Process Infographics Template for PowerPoint and Google Slides is a high-performance visual asset designed to streamline the presentation of sequential workflows and complex business logic. It features a dynamic S-curved layout that guides the viewer through five distinct stages of a process map, making it an essential tool for Project Managers and Operations Teams documenting standard operating procedures (SOPs) with a professional, “classy” aesthetic. By combining vibrant color-coded blocks with a structured design, this Vertical Process Infographics Template transforms technical data into a clear, easily digestible visual narrative.
This Vertical Process Infographics Template organizes data into a clear vertical S-curve to visualize step-by-step instructions, project phases, and customer journey mapping. It employs a color-coded system featuring coral red, warm yellow, sky blue, sage green, and bright blue—to enhance audience engagement and information retention. Sleek 3D connectors and cylindrical elements create a modern, high-end look that seamlessly connects each process block, while the inclusion of both light and dark mode variations ensures the infographic remains legible in any professional environment. The optimized two-column layout of the Vertical Process Infographics Template combines dedicated title and description areas with a color legend for effective strategic storytelling. Every shape, color, and text field is 100% editable to align perfectly with your specific brand guidelines, making it the perfect choice for Business Analysts, Consultants, and Trainers who need to present strategic planning or training materials to stakeholders.
Login to download this file


