


Smile Curve Business Value Chain Diagram Template for PowerPoint & Google Slides
Smile Curve Value Chain Analysis Presentation Template
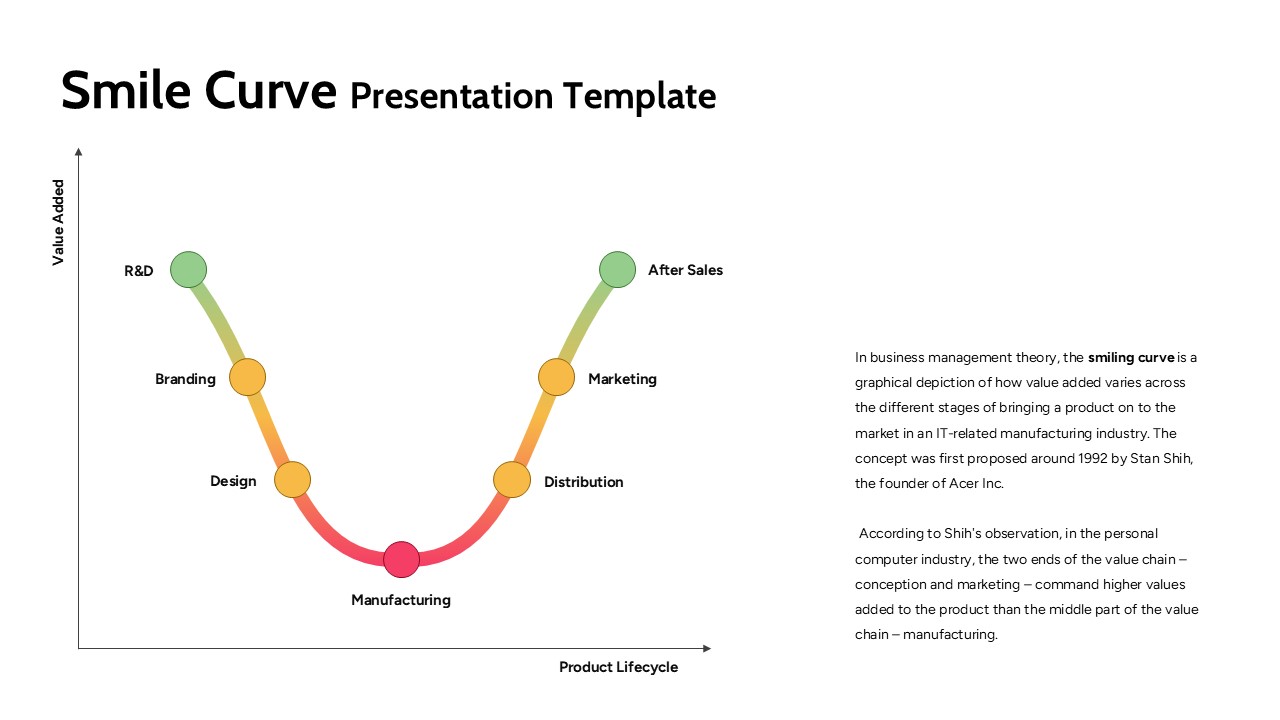
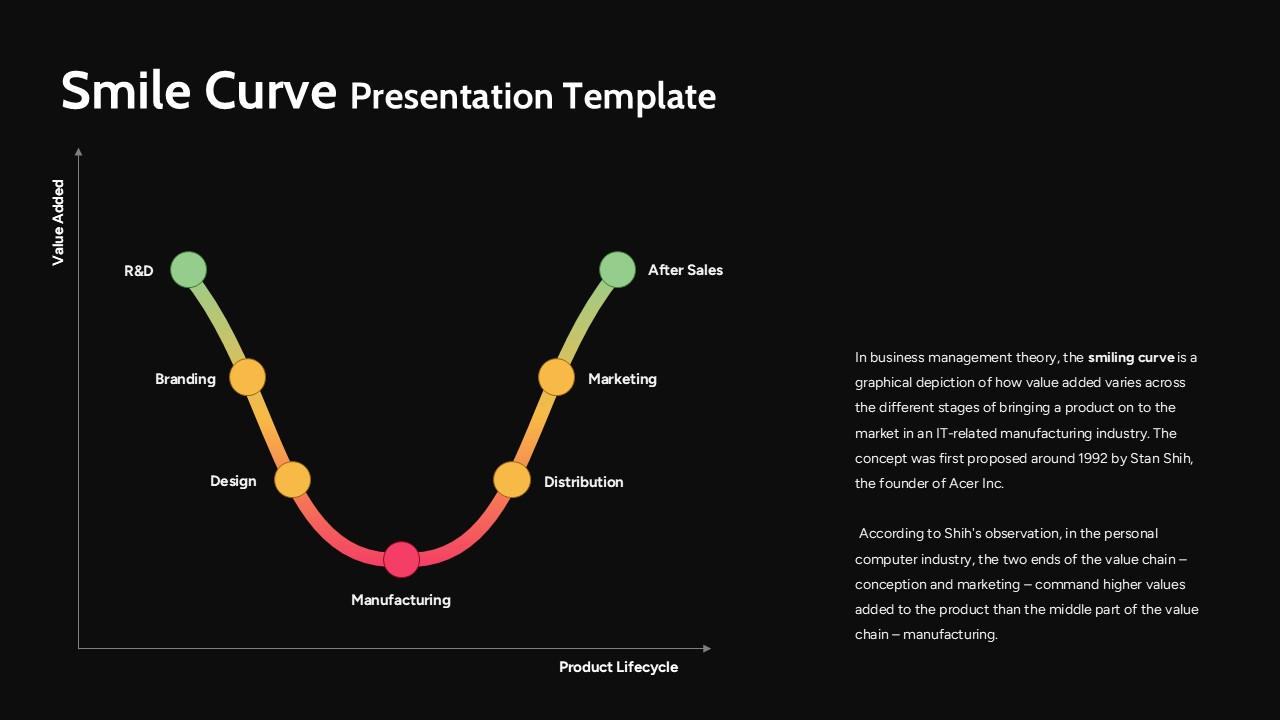
This Smile Curve presentation template is designed to clearly illustrate how value creation varies across different stages of the product lifecycle. The slide visualizes the classic smile curve concept, highlighting higher value-added activities at the early and late stages—such as research, branding, marketing, and after-sales while showing lower value concentration in the middle manufacturing phase. The curved diagram, color-gradient markers, and labeled touchpoints help audiences instantly grasp the strategic implications of value distribution.
Ideal for business analysis, strategy discussions, and management presentations, this Smile Curve slide supports clear storytelling around innovation, differentiation, and competitive advantage. The clean layout balances visual explanation with supporting text, making it easy to explain complex business management theories in a simple, structured way. Executives, consultants, and educators can use this template to connect theory with real-world value chain decisions.
Fully editable in PowerPoint and Google Slides, the Smile Curve presentation adapts seamlessly to different industries such as manufacturing, technology, consumer goods, and services. It is especially useful when paired with related business visuals such as value chain frameworks, strategic models, and process diagrams, allowing you to internally link this slide with other Business/Models assets to create a cohesive analytical deck. This makes it an excellent supporting slide for broader strategy, operations, and innovation presentations.
Features of this Smile Curve Presentationtemplate
• Curved value chain diagram illustrating value added across the product lifecycle.
• Clearly labeled stages including R&D, design, manufacturing, distribution, marketing, and after-sales.
• Color-coded nodes and smooth gradient flow for intuitive visual interpretation.
• Editable text, colors, and labels compatible with PowerPoint and Google Slides.
Why use this Smile Curve Presentation template
• Explains the smile curve theory in a visually intuitive and easy-to-understand format.
• Supports strategic discussions around innovation, branding, and value creation.
• Works seamlessly alongside other Business/Models slides for internal linking and structured decks.
• Saves time by providing a ready-made, presentation-ready analytical visual.
Who is it for
Business strategists, consultants, MBA students, educators, executives, and product managers presenting value chain analysis, competitive strategy, or innovation frameworks. Also suitable for corporate training sessions and academic presentations.
Login to download this file


