


Operations Dashboard Presentation Template for PowerPoint & Google Slides


Operations Dashboard Presentation Template
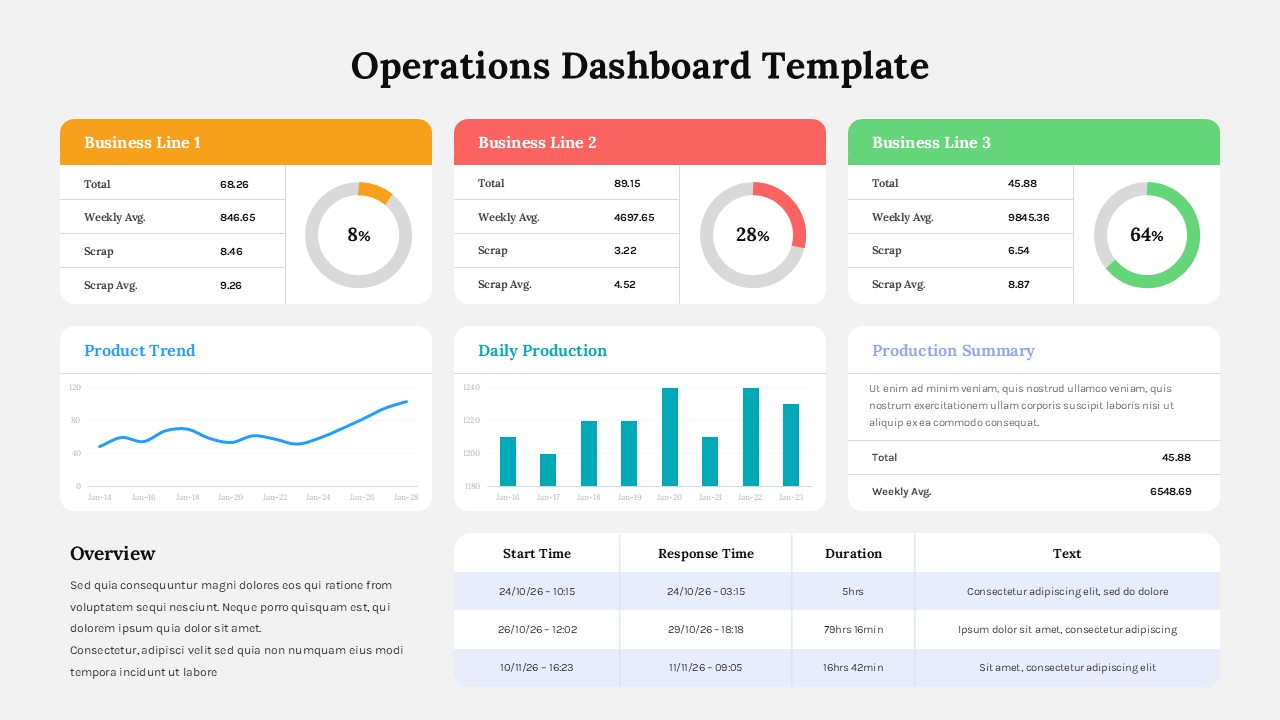
This Operations Dashboard Template for PowerPoint & Google Slides provides a comprehensive visual layout featuring six distinct sections arranged in a clean grid format. The design includes three color-coded business line cards with circular progress indicators, line and bar charts for trend analysis, and a professional data table for operational metrics. Available in both light and dark themes, the template uses orange, red, and green accent colors for clear visual hierarchy and modern appeal.
This Operations Dashboard Template for PowerPoint & Google Slides is ideal for manufacturing operations, production monitoring, and executive reporting scenarios. Operations managers, plant supervisors, and business executives will benefit from its ability to display real-time KPIs, track production trends, and compare performance across multiple business lines. The template supports comprehensive operational analysis, enabling quick assessment of efficiency metrics, scrap rates, and daily production levels in professional presentations.
The template offers full editability with customizable charts, KPI metrics, and color schemes to match your corporate branding. Users can easily update data visualizations, modify text placeholders, and adjust the layout to suit specific operational requirements. This flexibility ensures your operations dashboard remains current and actionable for stakeholder presentations.
Features of this template
• Six-section grid layout with business line performance cards and progress indicators
• Interactive charts including line graphs, bar charts, and operational data tables
• Dual theme options with light and dark backgrounds for versatile presentation environments
• Color-coded sections using orange, red, and green for clear visual differentiation
• Professional KPI tracking with circular progress meters and numerical displays
Why use this template
• Streamlines operational reporting with comprehensive visual metrics display
• Enhances executive presentations with professional dashboard aesthetics
• Saves time with pre-designed layouts optimized for operational data
• Improves decision-making through clear visualization of performance trends
Who is it for
This template is perfect for operations managers, plant supervisors, production coordinators, business executives, manufacturing directors, and quality control specialists who need to present operational performance data, monitor KPIs, track production metrics, and communicate efficiency improvements to stakeholders and management teams.
Login to download this file


