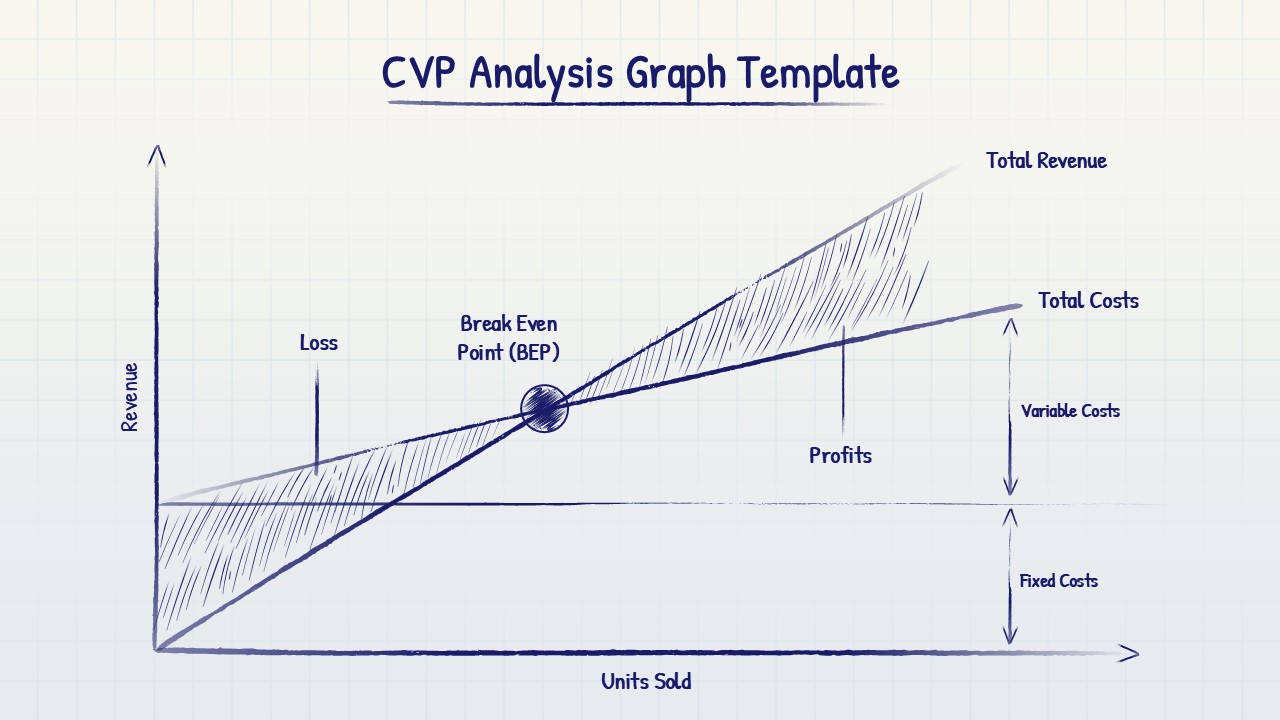
Cvp Analysis Graph Template

CVP Analysis Graph template with navy blue lines showing break-even point, revenue/cost curves, and profit/loss zones

This template is part of a deck featuring multiple slides. To check out all slides.

See All

Product Description

A professional Cost-Volume-Profit analysis chart template featuring intersecting total revenue and total costs lines on a light background. The graph clearly marks the break-even point where the lines cross, with shaded areas indicating loss and profit zones. All elements use a clean navy blue color scheme with diagonal hatching patterns.

Login to download this file

What do you think about this template? Give a rating