


CVP Analysis Graph PowerPoint & Google Slides Templates
Cost Volume Profit Break-Even Analysis Graph Presentation Template
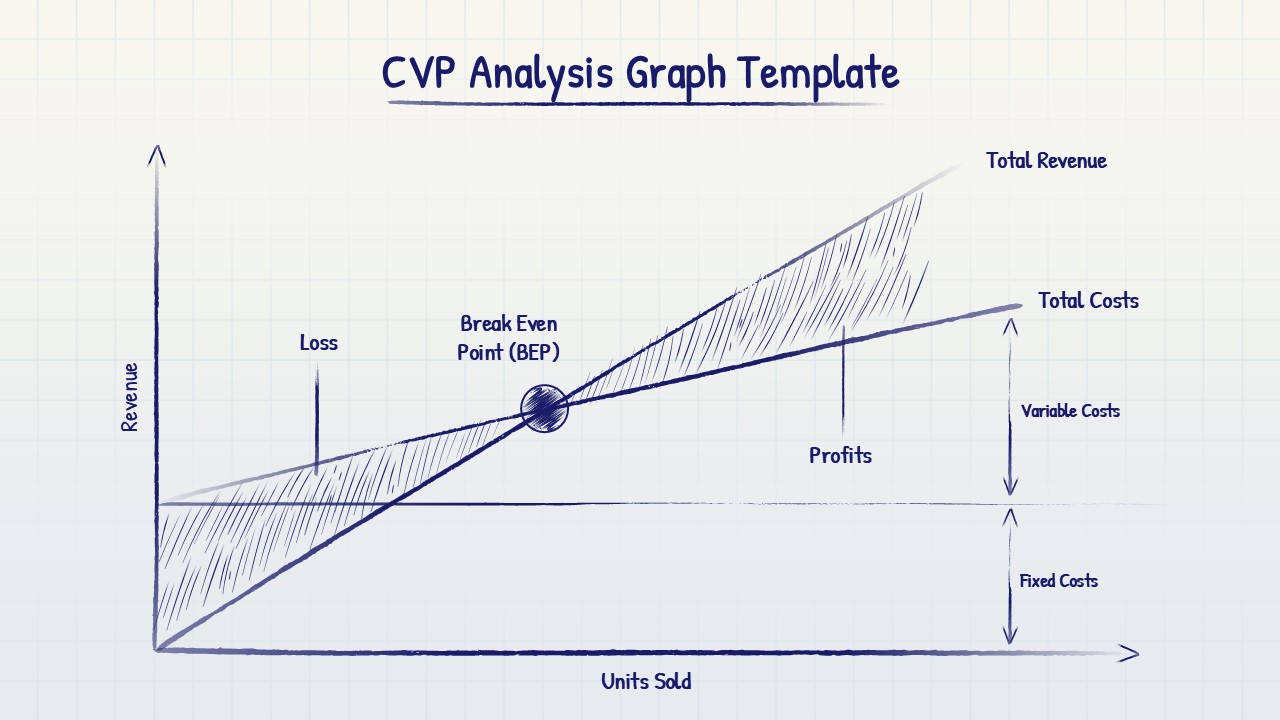
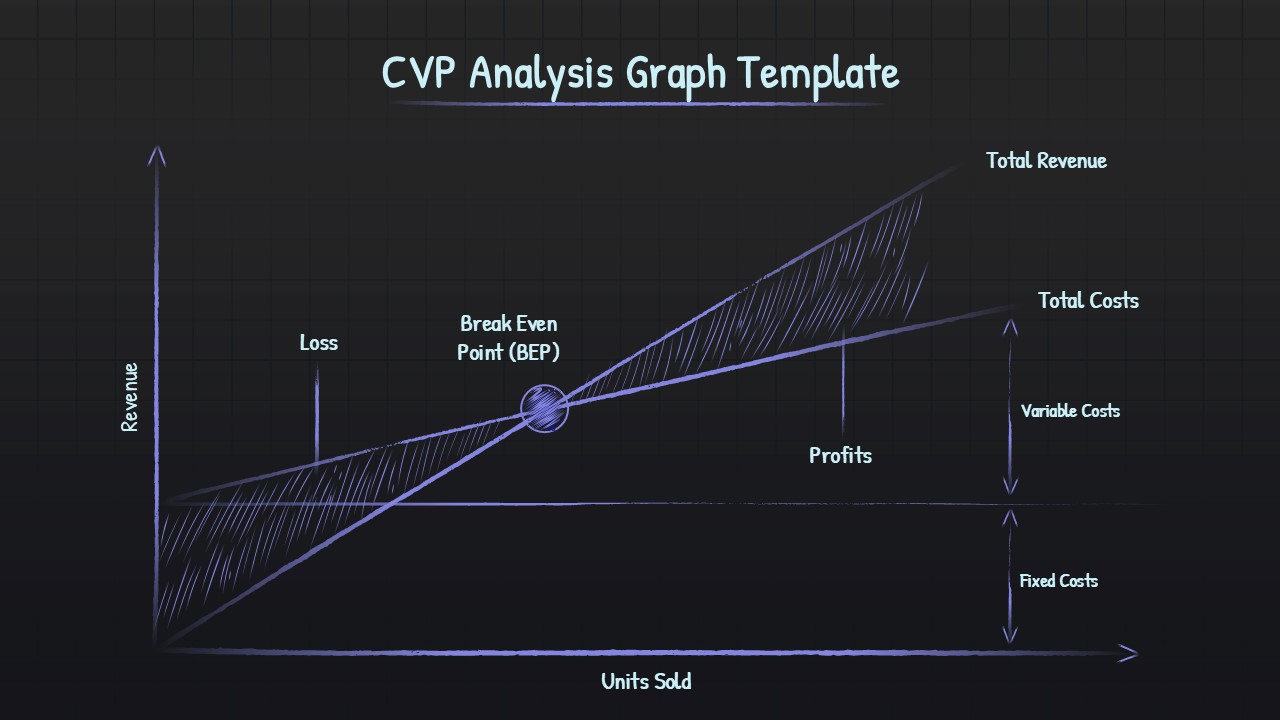
This CVP Analysis Graph Template for PowerPoint & Google Slides provides a comprehensive cost-volume-profit visualization with clearly marked break-even points, profit and loss zones, and total revenue versus total cost curves. The template features professional charting with labeled axes for units sold and revenue, color-coded sections for fixed and variable costs, and distinct shading patterns to highlight profit and loss areas. Available in both light and dark theme variations with modern grid layouts.
This CVP Analysis Graph Template is ideal for financial analysts, business managers, and entrepreneurs presenting break-even analysis, investment proposals, or strategic planning sessions. The template supports educational presentations for teaching cost-volume-profit relationships, management reporting on business performance metrics, and startup pitch decks demonstrating financial viability. Perfect for board meetings, investor presentations, and strategic planning workshops requiring clear financial data visualization.
The template offers complete customization with editable data points, adjustable cost curves, and modifiable color schemes to match your brand or presentation theme. Users can easily input their own financial data, adjust break-even calculations, and modify visual elements to create compelling financial presentations that drive informed decision-making.
Features of this CVP Break-Even Analysis Graph template
• Professional CVP analysis chart with clear break-even point visualization
• Dual theme options with light and dark background variations
• Color-coded profit and loss zones with distinctive shading patterns
• Fully labeled axes and cost components for easy data interpretation
• Compatible with both PowerPoint and Google Slides platforms
Why use this template
• Simplifies complex financial relationships into clear visual format
• Enhances presentation credibility with professional chart design
• Saves time with pre-built CVP analysis framework
• Supports data-driven decision making with visual break-even analysis
Who is it for
This template is perfect for financial analysts, business consultants, CFOs, business students, startup founders, investment managers, and educators teaching financial analysis. Ideal for professionals presenting cost structures, break-even scenarios, business plans, financial forecasts, and strategic investment decisions to stakeholders, investors, or academic audiences.
Login to download this file


