


Colourful Pyramid Chart PowerPoint & Google Slides Templates

High-Performance 6-Level Pyramid Chart for Data Hierarchy & Strategy
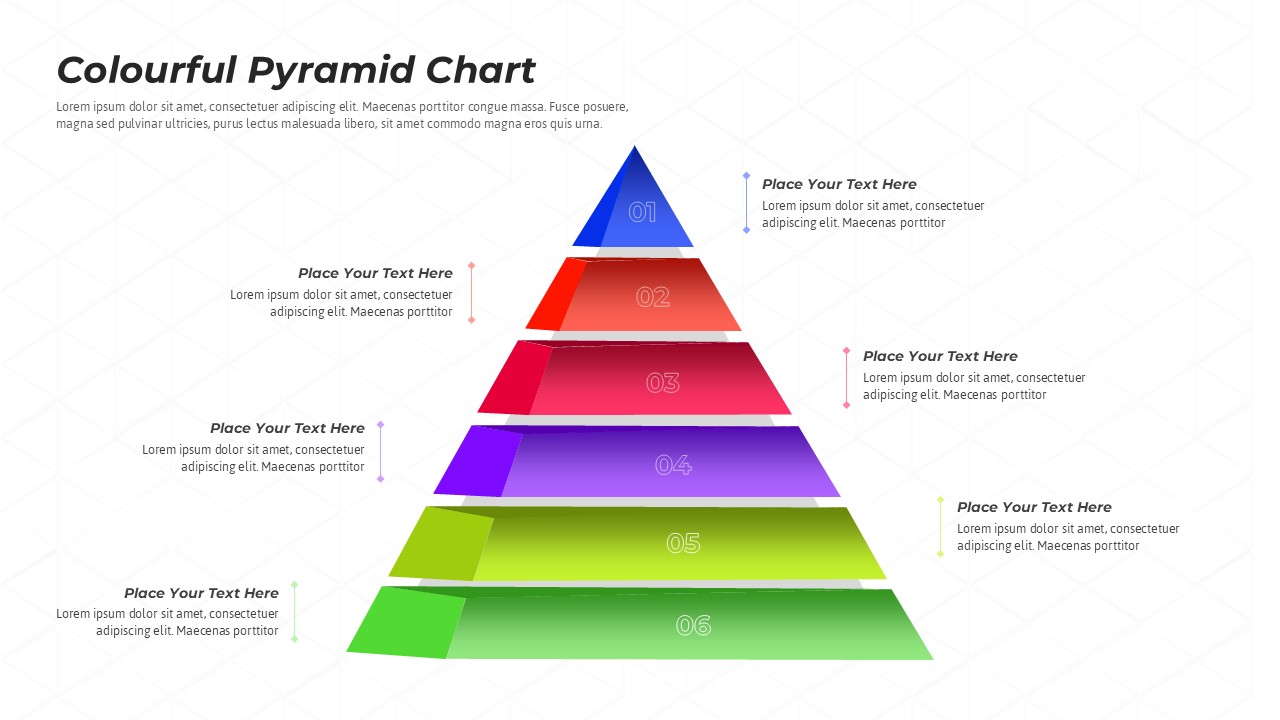
Effective hierarchical visualization is the cornerstone of any persuasive business or academic presentation. This Colourful Pyramid Chart for PowerPoint and Google Slides provides a high-fidelity solution for mapping complex relationships, from foundational operational data to top-level executive goals. By moving beyond basic 2D triangles, this template utilizes a modern flat design with subtle 3D perspective effects, giving your data a sense of structural weight and professional authority. The six-level architecture is meticulously color-coded, flowing from a sharp, focused Azure blue at the apex down to a broad, foundational forest green, which naturally signals the transition from high-value objectives to large-scale supporting resources.
The template’s layout is engineered for maximum scannability and “Cognitive Load Reduction.” Instead of cramming text into the pyramid segments, it features a balanced, symmetrical system of side-positioned callout areas. Each of the six numbered levels is linked via precise leader lines to its corresponding description, ensuring your audience can follow the logical progression without visual clutter. This level of organization makes it an indispensable asset for business analysts, project managers, and educators who need to visualize Maslow’s Hierarchy of Needs, corporate priority frameworks, or multi-step process flows.
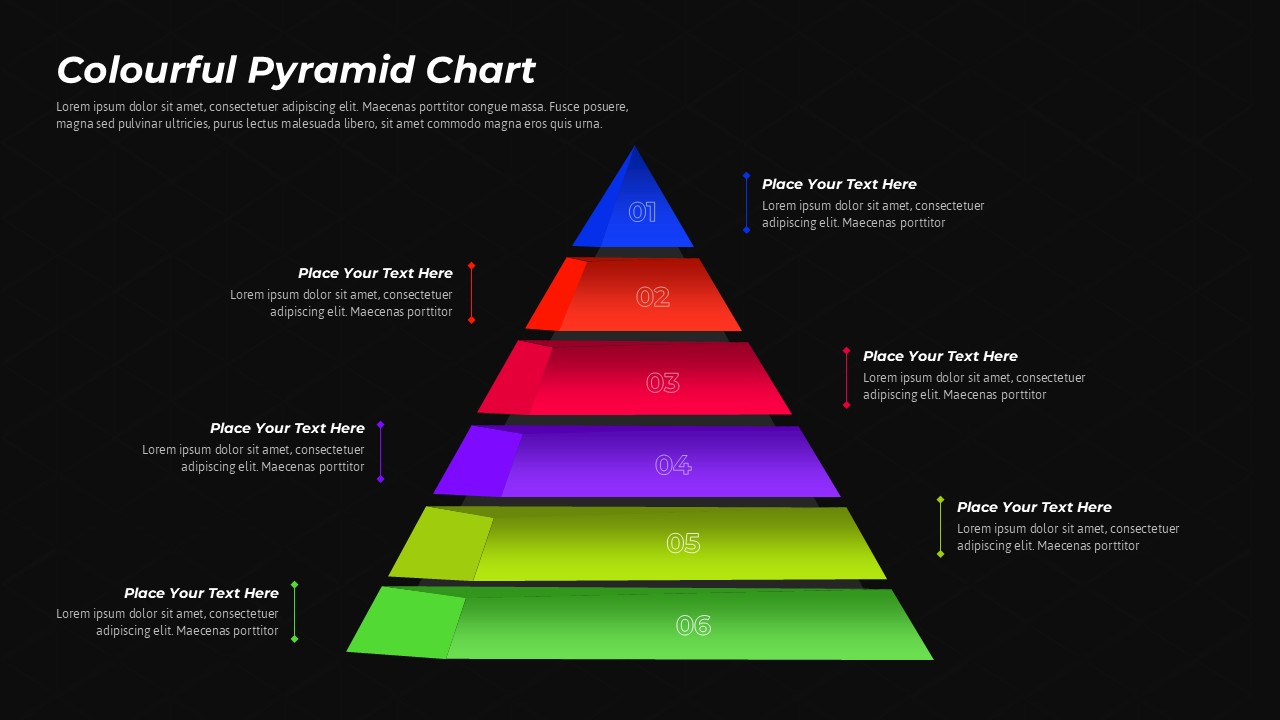
Versatility is built into the technical core of the slide. Every element is a native vector shape, allowing you to recolor the tiers or adjust the typography to match your corporate brand identity in seconds. Additionally, the inclusion of both light and dark background variations ensures that your strategic model remains crisp and high-contrast in any environment, whether it’s a sunlit boardroom or a digital webinar. Optimized for 16:9 widescreen displays, this template transforms abstract hierarchies into a clear, memorable visual narrative that bridges the gap between complex data and actionable audience understanding.
Login to download this file


