


Colorful Quarterly Gantt Chart Template for PowerPoint & Google Slides

Quarterly Project Gantt Chart Presentation Template
Deadlines don’t wait, and neither should your planning.
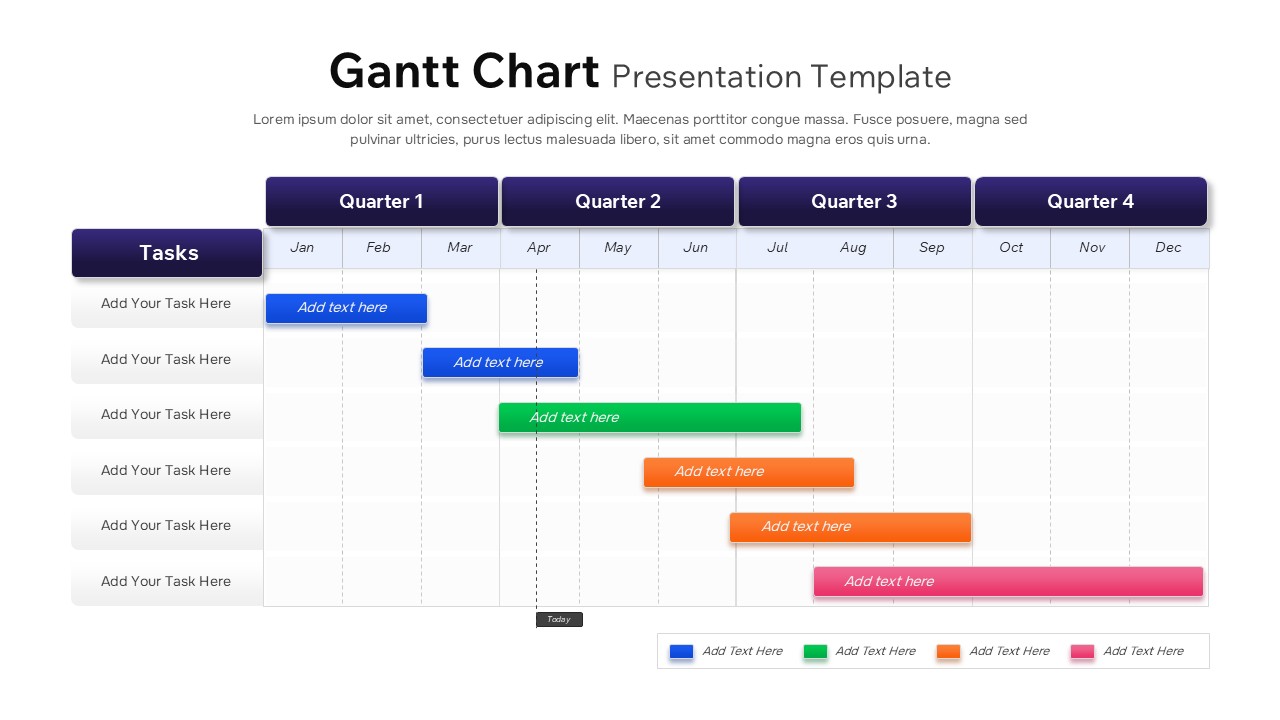
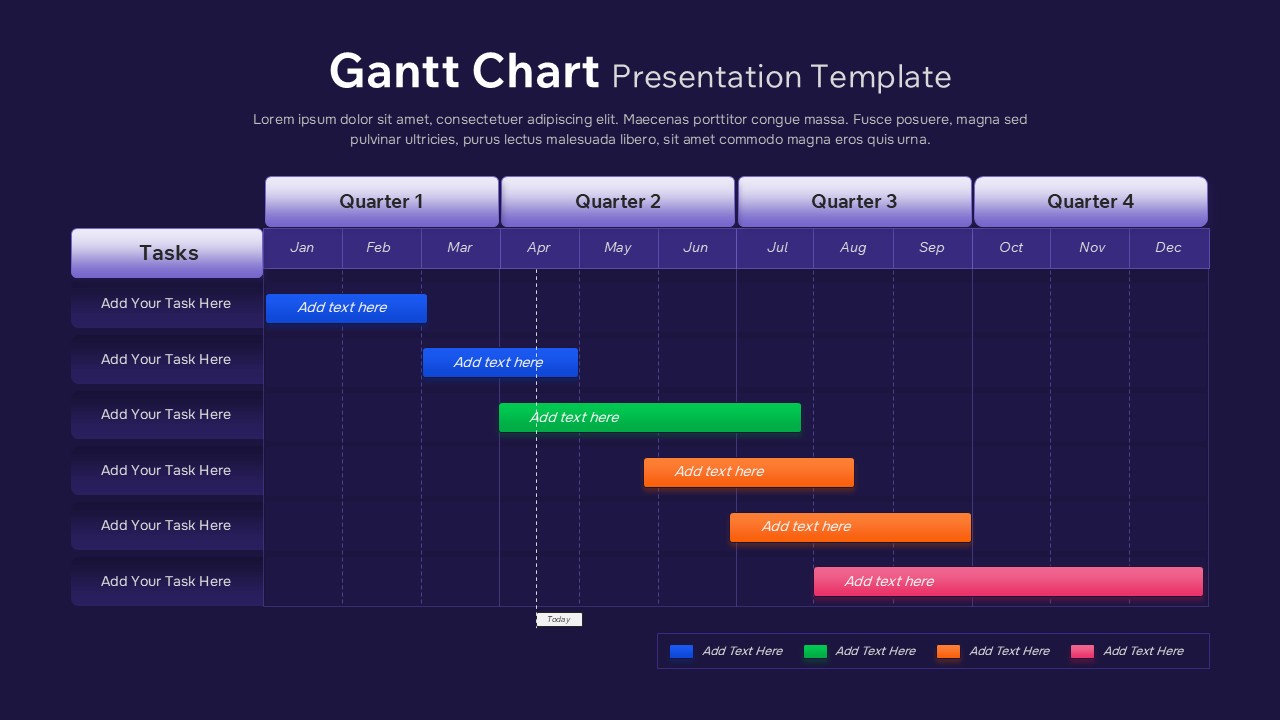
When you’re juggling tasks across months, a Gantt chart isn’t just helpful – it’s the difference between a team that drifts and one that delivers. This template gives you a full-year view, broken into four quarters, so everyone on your team knows exactly where the project stands at a glance.
The design does the heavy lifting for you. Bold, color-coded task bars in blue, green, orange, and pink make it easy to distinguish workstreams without squinting at a spreadsheet. Monthly gridlines keep the timeline honest, and the built-in “Today” marker means you’re always anchored to the present – no guesswork about where you are in the schedule.
Here’s what you get out of the box:
• A full-year layout divided into four clearly labelled quarters, Q1 through Q4, with bold headers for quick navigation
• Color-coded task bars with editable durations and labels to match your workflow
• Monthly gridlines and a “Today” marker for live progress tracking
• A dedicated task column that keeps your project listing clean and structured
• Full compatibility with both PowerPoint and Google Slides, so you can edit colors, labels, durations, and task placements to your heart’s content
This Gantt Chart earns its place in your toolkit because it makes communication easier. Whether you’re walking stakeholders through a roadmap, running a PMO status review, or just getting your team aligned before a busy quarter, the clean grid and high-contrast visuals cut through the noise fast.
Here’s why the Gantt Chart works so well in practice:
• Gives everyone a clear overview of project schedules and task dependencies
• Sharpens communication in planning, review, and reporting meetings
• Adapts easily to different workflows, team sizes, and project frameworks
• Keeps stakeholders aligned with a visual format that looks as polished as it performs
Project managers, team leads, operations planners, consultants, educators, and PMOs all reach for this kind of template when they need to present timelines clearly — or keep long-term initiatives on track without losing people in the details.
Your next project kickoff deserves a Gantt Chart that actually looks like one.
Login to download this file


