




Bradley Curve Templates
Bradley Curve Template for PowerPoint
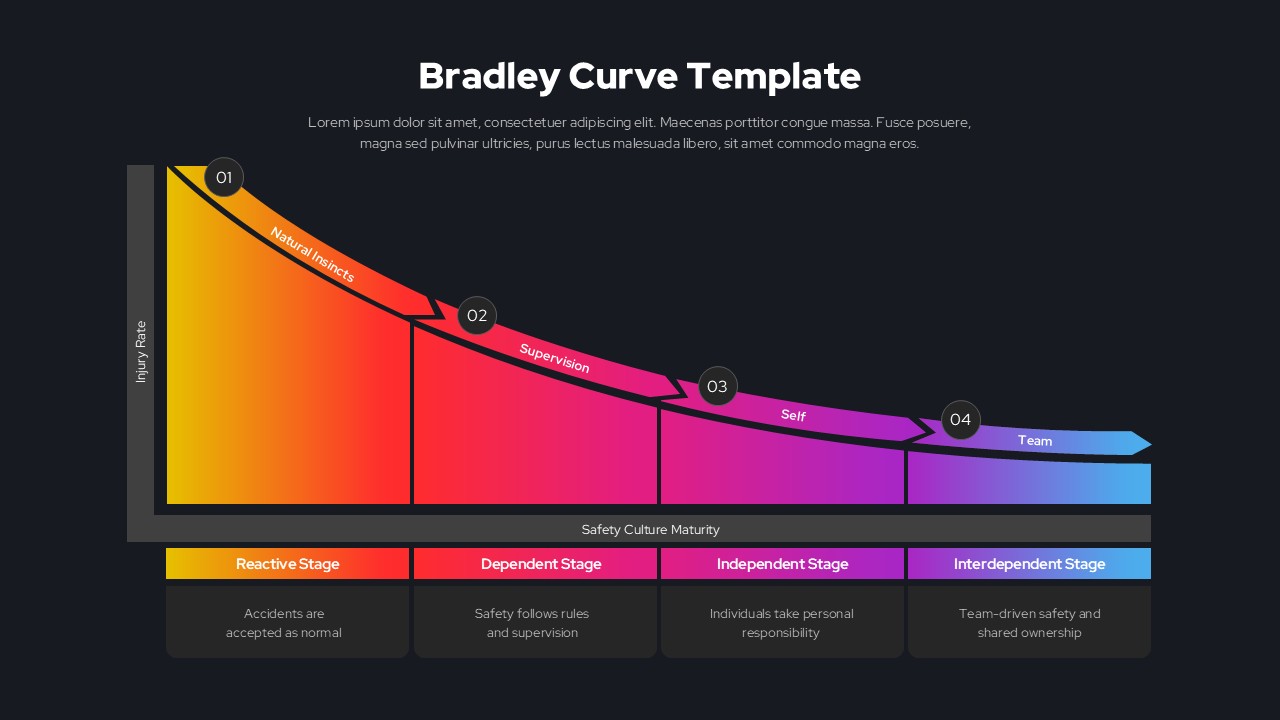
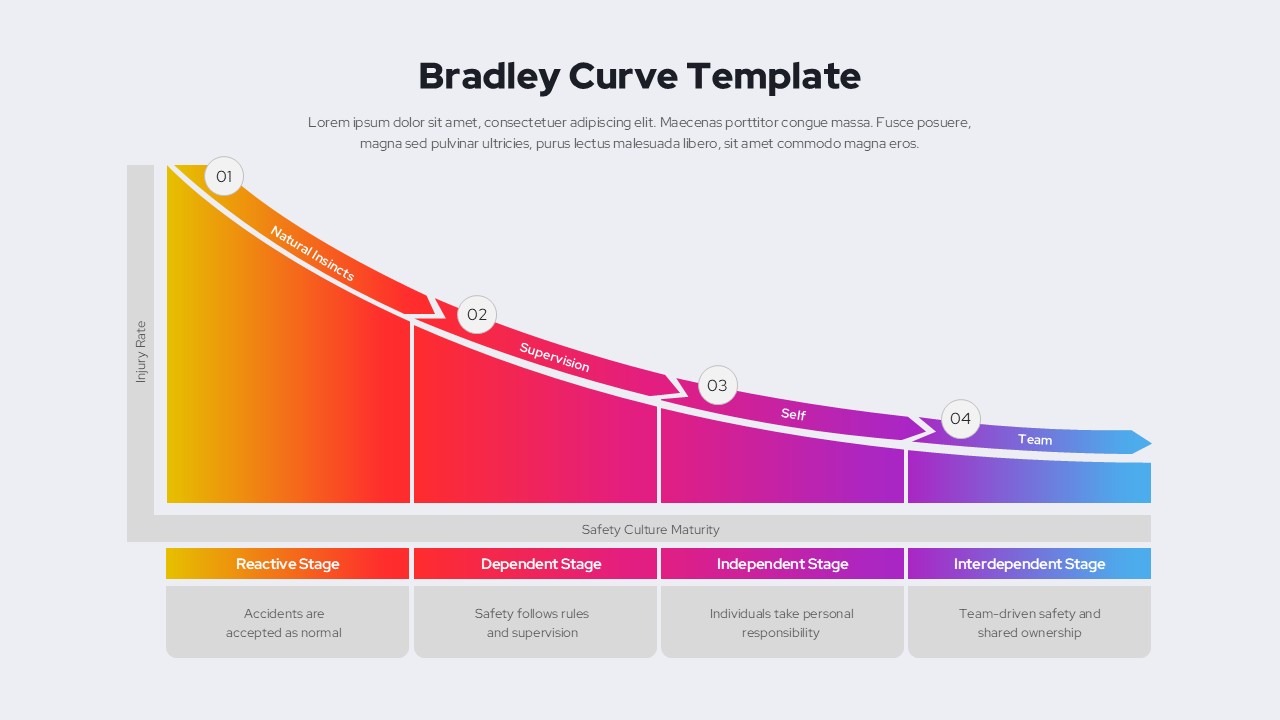
The Bradley Curve Template for PowerPoint is a data-driven infographic slide that visualizes how workplace safety culture evolves over time. Built on a dark background with a bold gradient arrow running from orange and red into magenta and blue, the design illustrates the well-known relationship between safety culture maturity and injury rate, one of the most widely referenced models in occupational safety and EHS training.
The slide is divided into four stages, each marked with a numbered circular badge and a short behavioral label: Natural Instincts, Supervision, Self, and Team. These labels correspond to the four phases of the Bradley Curve model, moving from reactive, instinct-driven behavior toward a fully interdependent, team-owned safety culture. A labeled vertical axis (Injury Rate) and horizontal axis (Safety Culture Maturity) frame the curve, giving the slide the structure of an actual chart rather than a purely decorative graphic.
Beneath the main visual, four color-coded stage cards expand on each phase with a short description: the Reactive Stage, where accidents are accepted as normal; the Dependent Stage, where safety follows rules and supervision; the Independent Stage, where individuals take personal responsibility; and the Interdependent Stage, defined by team-driven, shared ownership of safety outcomes. This layout gives presenters both a high-level overview and ready-made supporting detail for each stage.
This Bradley Curve Template is well suited for EHS training sessions, safety culture audits, HR onboarding materials, leadership reporting, and consulting presentations built around organizational maturity frameworks. All text, colors, and stage labels are fully editable in PowerPoint and Google Slides, so the model can be adapted to a company’s own terminology, brand colors, or a related maturity framework entirely.
Login to download this file


Related Templates

Free Proof Of Concept Template
Process


