


Data Lake Diagram PowerPoint & Google Slides Templates
Data Lake Diagram Template
Modern data strategy is only as effective as your ability to explain it. The Data Lake Diagram Template for PowerPoint & Google Slides bridges the gap between complex architecture and clear communication giving data teams a polished, ready-to-use visual that makes even the most technical concepts accessible to any audience.
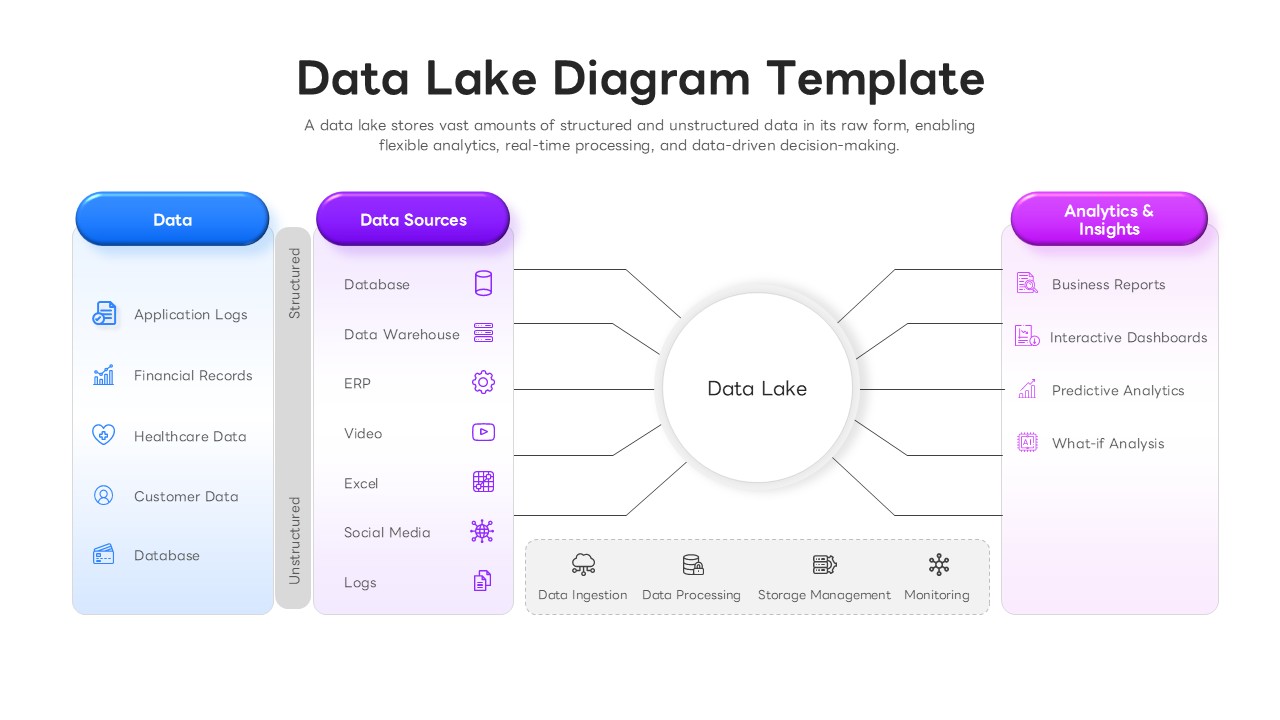
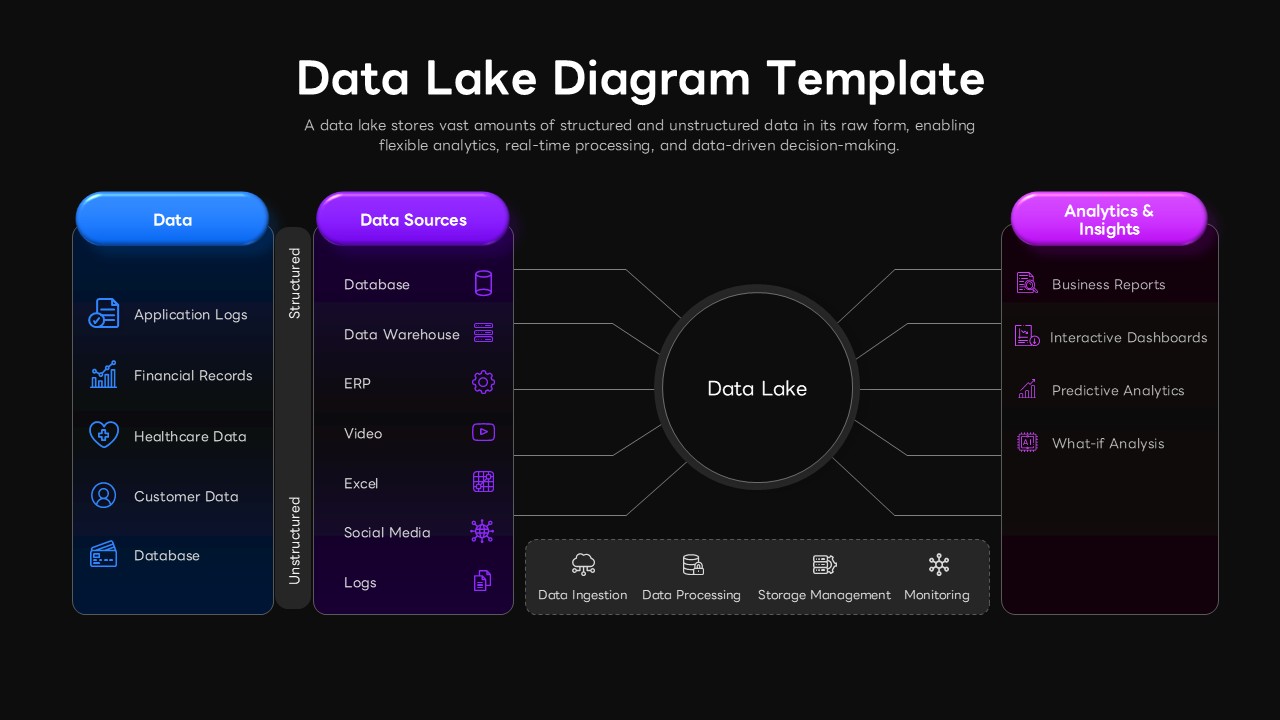
Built around a hub-and-spoke design, the template organises your data story into three intuitive sections: data sources on the left, a central Data Lake hub at the core, and analytics outputs on the right. A clean gradient colour scheme transitioning from blue to purple gives the layout a modern, professional feel, while dedicated icons represent databases, ERP systems, social media feeds, dashboards, reports, and predictive analytics tools. The symmetrical structure ensures that both technical reviewers and executive stakeholders can follow the flow without needing a guided tour.
Whether you’re presenting a digital transformation roadmap, walking leadership through an analytics platform overview, or aligning your engineering team around a new data architecture, this template removes the design work so you can focus entirely on the content. Light and dark theme options make it easy to match your organisation’s branding or adapt to different presentation environments.
Features of Data Lake Diagram Template
Hub-and-spoke data lake architecture with clear, directional process flows
Data source categories covering databases, ERP systems, and social media
Analytics output sections for reports, dashboards, and predictive analytics
Light and dark theme options for flexible presentation environments
Gradient colour scheme with modern icons and clean, professional typography
Who It’s For
Built for data architects, IT directors, chief data officers, business analysts, and enterprise architects who need to present data lake strategies, analytics platforms, and digital transformation initiatives to executive teams, technical staff, and business stakeholders clearly, confidently, and without spending hours on slide design.
Login to download this file


