


P&L Dashboard PowerPoint & Google Slides Templates


Financial KPI P&L Dashboard Presentation Template
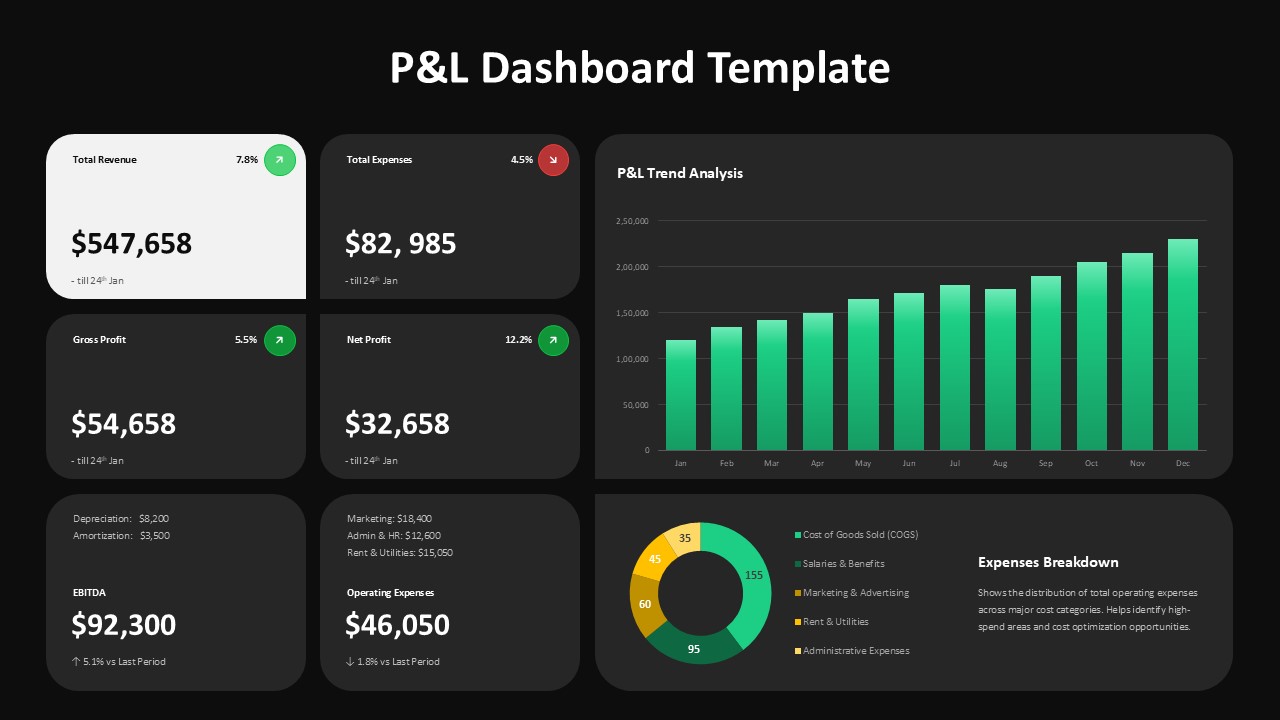
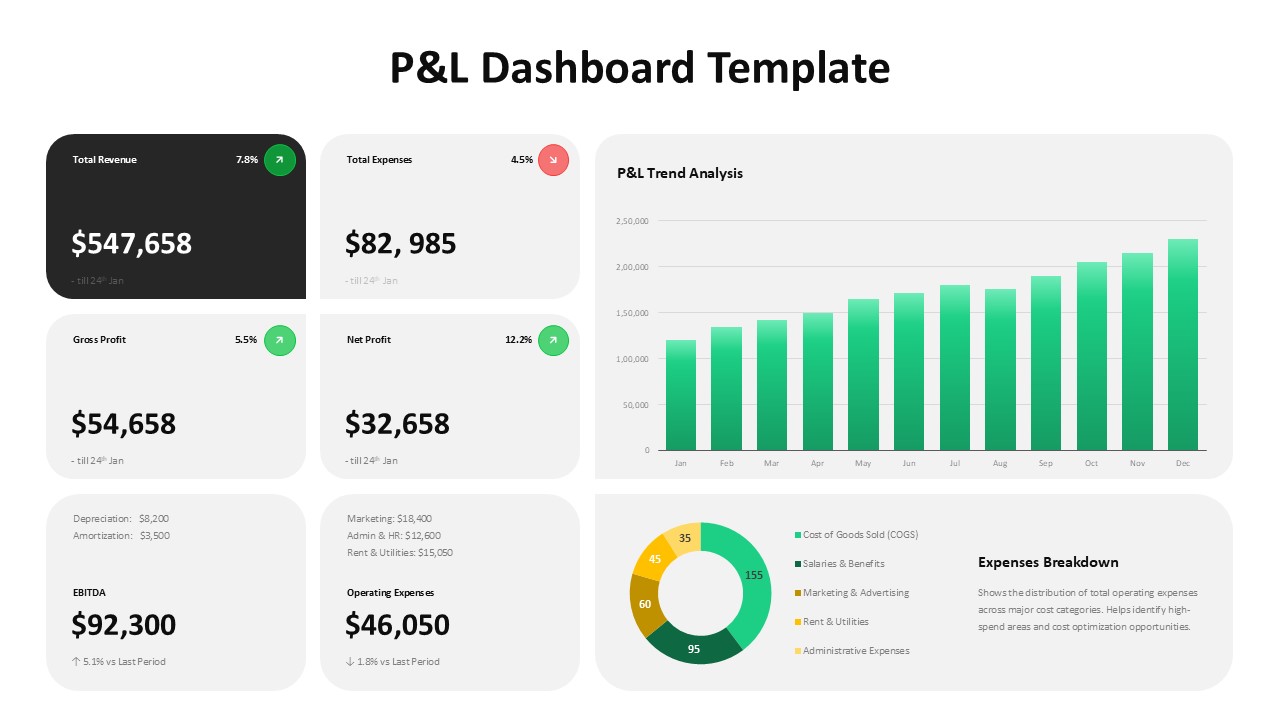
This P&L Dashboard Template for PowerPoint & Google Slides provides a comprehensive financial reporting layout featuring six key metric cards arranged in a 2×3 grid, alongside dynamic bar charts and donut charts. The template showcases essential financial KPIs including total revenue, expenses, gross profit, net profit, EBITDA, and operating expenses with color-coded trend indicators. Both dark and light theme variations are included, featuring vibrant green accents for positive metrics, red for negative trends, and professional rounded corners with subtle shadows for a modern corporate aesthetic.
This P&L Dashboard Template for PowerPoint & Google Slides is ideal for CFOs, financial analysts, and business managers who need to present monthly or quarterly financial performance data to executives, board members, and stakeholders. The template supports comprehensive profit and loss reporting, budget reviews, financial trend analysis, and strategic planning sessions. It’s perfect for organizations requiring clear visualization of revenue streams, expense breakdowns, and profitability metrics in board presentations, investor meetings, and internal financial reviews.
The template offers complete editability for all charts, metrics, and design elements, allowing users to customize data points, color schemes, and branding elements. Users can easily update financial figures, adjust time periods, and modify chart types to match specific reporting requirements. This flexibility ensures consistent, professional financial presentations that effectively communicate business performance and drive data-driven decision making.
Features of this P&L Dashboard template
• Comprehensive KPI dashboard with 6 key financial metrics and trend indicators
• Interactive bar charts showing monthly financial performance over 12-month periods
• Detailed expense breakdown donut charts with customizable categories
• Both dark and light theme variations for different presentation environments
• Fully editable charts, metrics, and color schemes for complete customization
Why use this P&L Dashboard template
• Streamlines financial reporting with professional, easy-to-understand visualizations
• Saves time in creating comprehensive P&L presentations from scratch
• Enhances stakeholder engagement through clear, visual financial storytelling
• Provides consistent formatting for regular financial reporting cycles
Who is it for
This template is designed for CFOs, financial directors, business analysts, finance managers, controllers, and executive teams who regularly present profit and loss statements, financial performance reviews, budget analyses, and quarterly reports to boards, investors, stakeholders, and management teams.
Login to download this file


