




Financial KPI Dashboard Overview Template for PowerPoint & Google Slides

Financial Performance KPI Dashboard Presentation Template
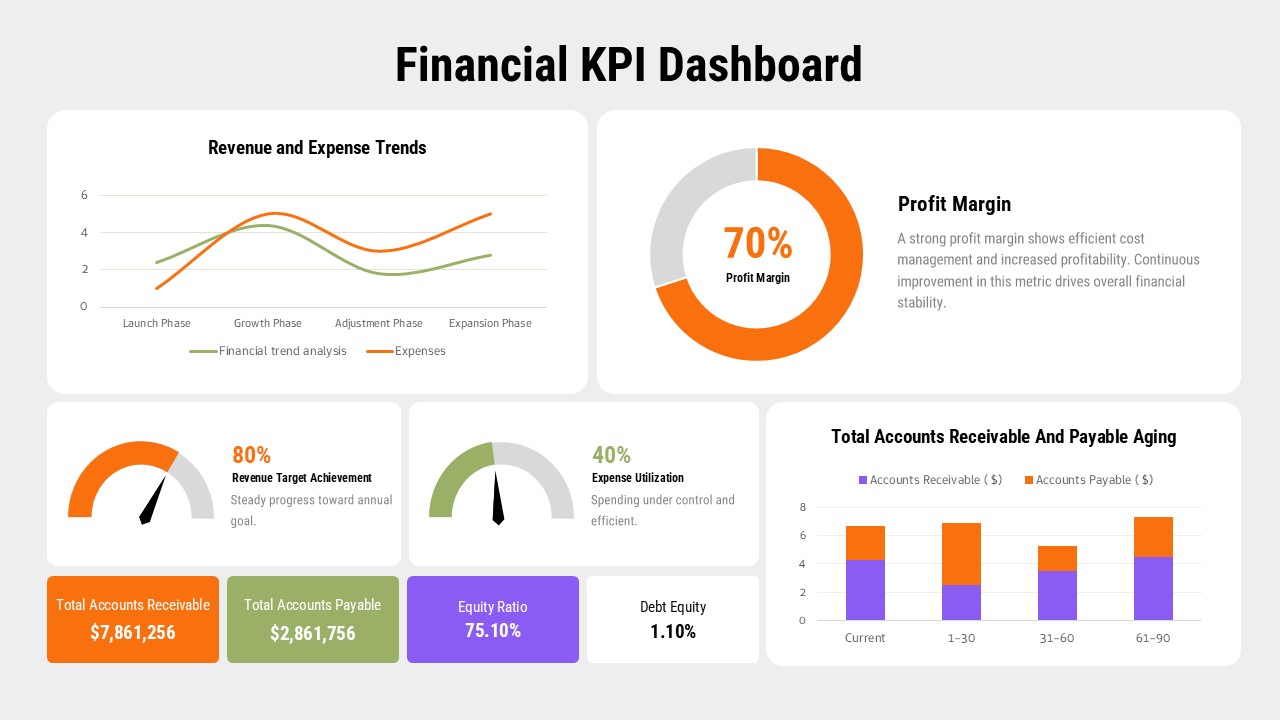
This Financial KPI Dashboard template delivers a clear, high-level view of financial performance in a single, structured layout. Built with multiple visual components including line charts, donut charts, gauges, and bar graphs, the dashboard lets decision-makers quickly evaluate revenue trends, expense control, profitability, and balance sheet health. Each KPI block is visually separated, so executives and analysts can scan results efficiently without losing context or digging through raw numbers.
The Financial KPI Dashboard highlights critical indicators such as profit margin, revenue target achievement, expense utilization, accounts receivable and payable aging, equity ratio, and debt to equity ratio. Trend charts illustrate financial movement across phases, while circular progress indicators show performance against targets at a glance. Color-coded elements guide the eye toward key metrics while keeping the overall design cohesive and professional, making it well suited for executive-level reporting.
Fully editable in PowerPoint and Google Slides, this Financial KPI Dashboard template lets you swap in your own values, adjust visuals, and align colors with corporate branding in minutes. It works well for recurring reports, monthly reviews, or board-level presentations where accuracy, clarity, and visual consistency matter. By consolidating complex financial data into one dashboard, this template helps your team move faster from raw numbers to confident financial decisions.
What’s included:
- KPI dashboard layout combining charts, gauges, and metric cards
- Visual indicators for profit margin, revenue targets, and expense utilization
- Dedicated sections for accounts receivable and payable aging analysis
- Fully editable charts, text, colors, and values
- Compatible with PowerPoint and Google Slides
Download the Financial KPI Dashboard Presentation Template from SlidesDepot and give your next financial review a clear, consistent, and professional format.
What is a Financial KPI Dashboard?
A Financial KPI Dashboard is a single visual layout that consolidates key financial metrics, such as profit margin, revenue targets, and expense utilization, into charts, gauges, and metric cards for quick, at-a-glance analysis.
Login to download this file


