




Profit and Loss Dashboard PowerPoint & Google Slides Templates
P&L Dashboard Template
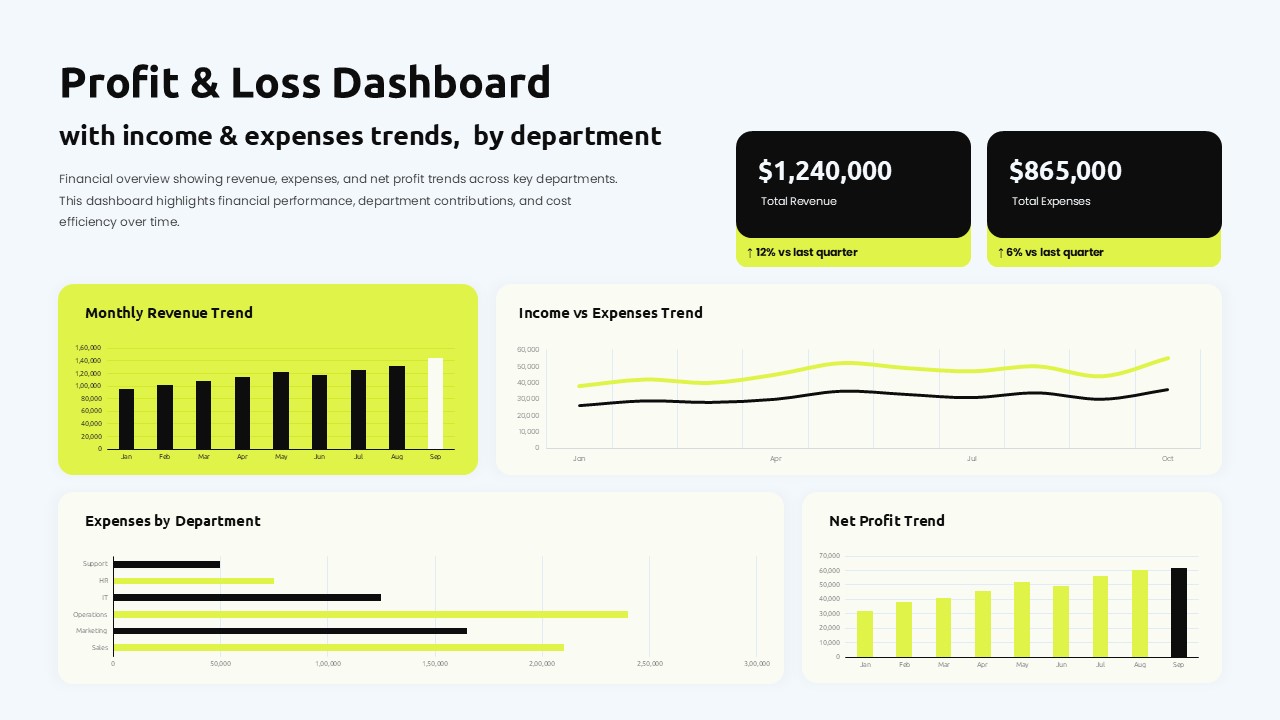
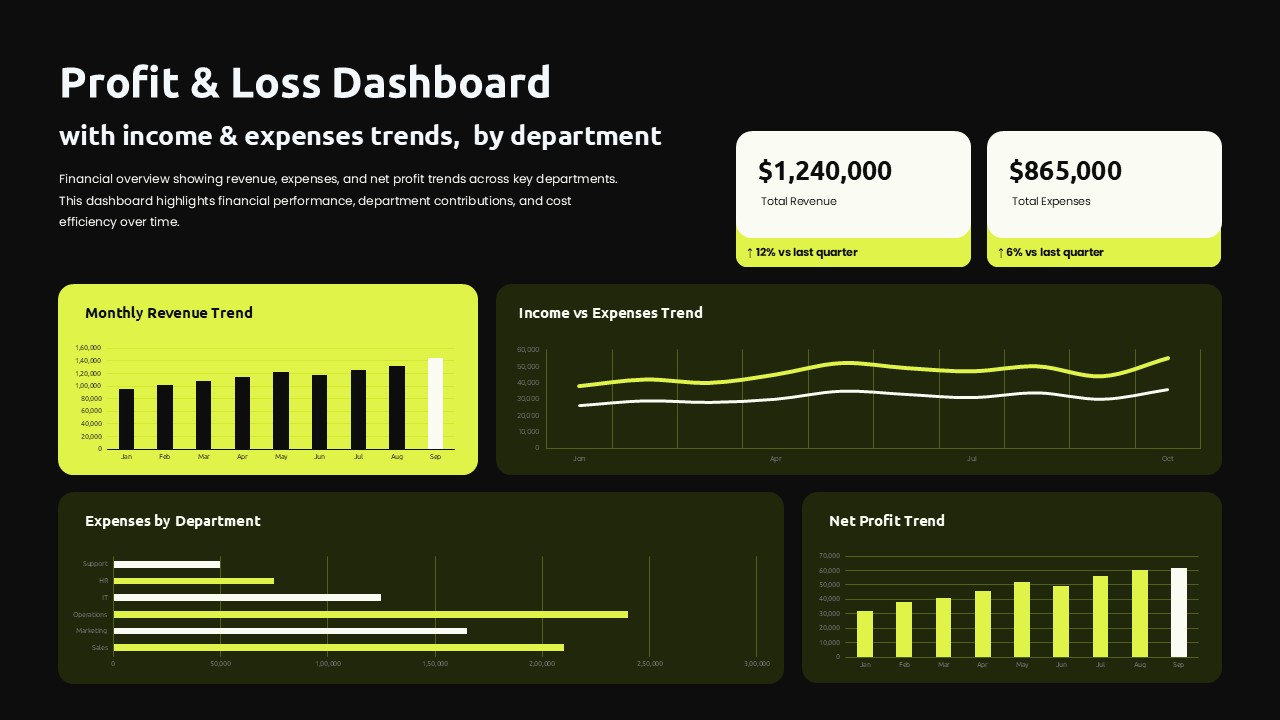
This Profit and Loss Dashboard Template for PowerPoint & Google Slides provides a sleek, data-forward layout featuring a 2×2 chart grid, dual KPI metric cards, and five distinct visualizations — including monthly revenue bar charts, income vs. expenses area/line charts, departmental horizontal bars, and a net profit trend chart. Built around a modern minimalist design with a bold chartreuse yellow-green accent, it ships in both light and dark theme variants, ensuring visual consistency across any presentation environment or brand preference.
This Profit and Loss Dashboard Template for PowerPoint & Google Slides is ideal for finance teams, CFOs, and business analysts who need to communicate complex financial data with clarity and impact. It supports quarterly business reviews, executive boardroom presentations, annual financial reports, and departmental budget analyses. Whether you are tracking revenue growth, comparing income against expenses, or breaking down costs by department, this template delivers the structure and visual hierarchy needed to drive informed decision-making.
Every element of this template is fully editable — swap in your own figures, adjust chart colors, resize panels, or switch between the light and dark themes to match your brand identity. Compatible with both PowerPoint and Google Slides, it requires no design expertise. Simply replace the placeholder data and deliver a polished, professional financial dashboard that commands attention and saves hours of formatting time. Following are some features of this template
• Dual light and dark theme variants for versatile presentation environments
• 2×2 dashboard grid with five financial chart types — bar, horizontal bar, and area/line charts
• Pre-built KPI cards displaying total revenue, total expenses, and quarter-over-quarter trend indicators
• Modern minimalist design with chartreuse yellow-green accent for high-contrast data readability
• 16:9 widescreen aspect ratio optimized for screen and projector displays
This template is designed for CFOs, financial controllers, business analysts, and finance managers who regularly present P&L data to executive stakeholders. It is equally valuable for management consultants, SaaS finance teams, retail business owners, and corporate strategists who need to deliver quarterly reviews, budget presentations, or annual financial reports with a polished and data-driven visual format.
Login to download this file


