


Spider Web Diagram Infographic Template for PowerPoint & Google Slides
Radial Spider Chart Presentation Template for PowerPoint & Google Slides
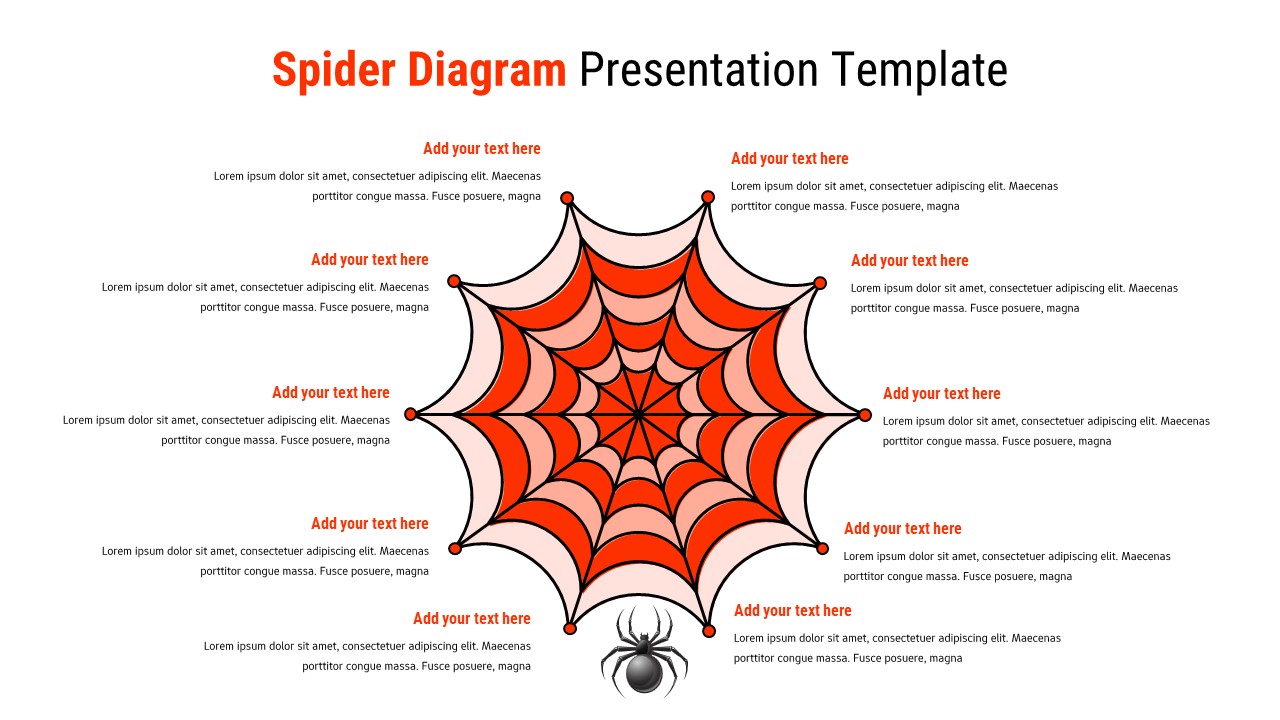
Showcase multi-point analysis with this Spider Web Diagram Infographic Template for PowerPoint & Google Slides. Designed with a bold radial layout, this slide features a central hub connected to ten outer nodes through a stylized spider web structure. Each point radiates outward evenly, making it ideal for presenting interconnected ideas, performance criteria, risk factors, or strategic pillars in a visually striking format. The layered web pattern draws attention to the center while naturally guiding the audience’s eye across every section.
This Spider Web Diagram Infographic Template combines a high-contrast red and black color scheme with soft neutral backgrounds to ensure readability and impact. Each outer node includes a headline and supporting text area, allowing you to clearly define categories, metrics, or discussion points. The symmetrical design ensures balance, while the bold lines and curved web layers create depth and structure without overwhelming your content.
Fully editable in PowerPoint and Google Slides, this Spider Web Diagram Infographic Template lets you modify text, adjust colors, resize elements, or reduce the number of nodes to match your needs. Whether you are presenting a competitive analysis, capability assessment, project overview, or brainstorming session, this radial framework transforms complex information into a cohesive visual story. It is especially effective when illustrating relationships between a core concept and multiple influencing factors.
Features of this template
• Radial spider web layout with ten evenly spaced connection points.
• Central hub design to highlight a main topic or objective.
• Clear headline and paragraph placeholders for each node.
• Fully customizable colors, text, and graphic elements.
Why use this template
• Organizes multiple ideas around one central concept for clarity.
• Enhances engagement with a bold, eye-catching visual structure.
• Ideal for comparative analysis, brainstorming, and strategic mapping.
• Saves time with a ready-to-use, professionally arranged layout.
Who is it for
This slide is suitable for business analysts, marketing teams, educators, consultants, and project managers who need to present multi-factor evaluations. It also supports students, trainers, and workshop facilitators organizing ideas around a central theme. Use it for performance reviews, capability mapping, SWOT alternatives, or strategic planning discussions.
Login to download this file


