


Simple Fact Sheet for PowerPoint & Google Slides

Simple Fact Sheet Data Overview Presentation Template
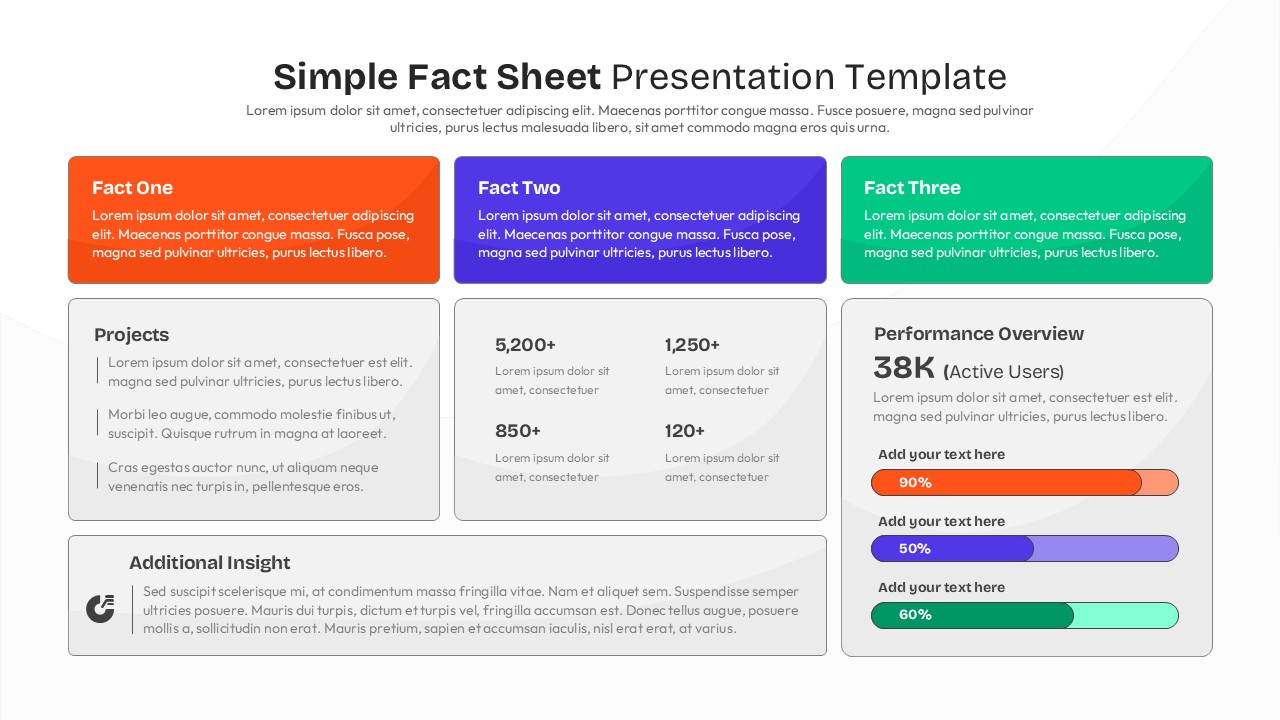
This Simple Fact Sheet for PowerPoint & Google Slides provides a clean, grid-based layout with six distinct content sections for comprehensive data presentation. The template features vibrant accent colors including orange, purple, and green against professional dark and light theme backgrounds. Key visual elements include colored fact boxes, statistical displays with progress bars, performance metrics, and organized content blocks with rounded corner cards for modern appeal.
This Simple Fact Sheet for PowerPoint & Google Slides is ideal for business professionals creating executive briefings, project status reports, and company overviews. The template perfectly supports quarterly reviews, stakeholder updates, marketing materials, and KPI dashboards. Business analysts, project managers, executives, and marketing teams will find this versatile format essential for presenting complex data in an easily digestible visual format.
The template offers complete customization with editable text placeholders, adjustable progress bars, and flexible color schemes. Both dark and light versions provide presentation versatility for different branding requirements and audience preferences. Transform your data into compelling visual stories that drive decision-making and stakeholder engagement.
Features of this Simple Fact Sheet template
• Dual theme options with professional dark and light versions
• Six-section grid layout for comprehensive data organization
• Vibrant color-coded sections with orange, purple, and green accents
• Interactive progress bars and statistical display elements
• Modern card-based design with rounded corners and clean typography
Why use this Simple Fact Sheet template
• Presents complex data in an easily digestible visual format
• Saves time with pre-designed professional layout structure
• Enhances credibility with modern, executive-level design aesthetics
• Increases audience engagement through clear visual hierarchy
Who is it for
This template is perfect for business executives, project managers, data analysts, marketing professionals, consultants, and team leaders who need to present key metrics, project updates, company performance, or strategic insights to stakeholders, clients, or executive teams.
Login to download this file


