


SIPOC Analysis Process Diagram Template for PowerPoint & Google Slides
SIPOC Analysis Framework Presentation Template
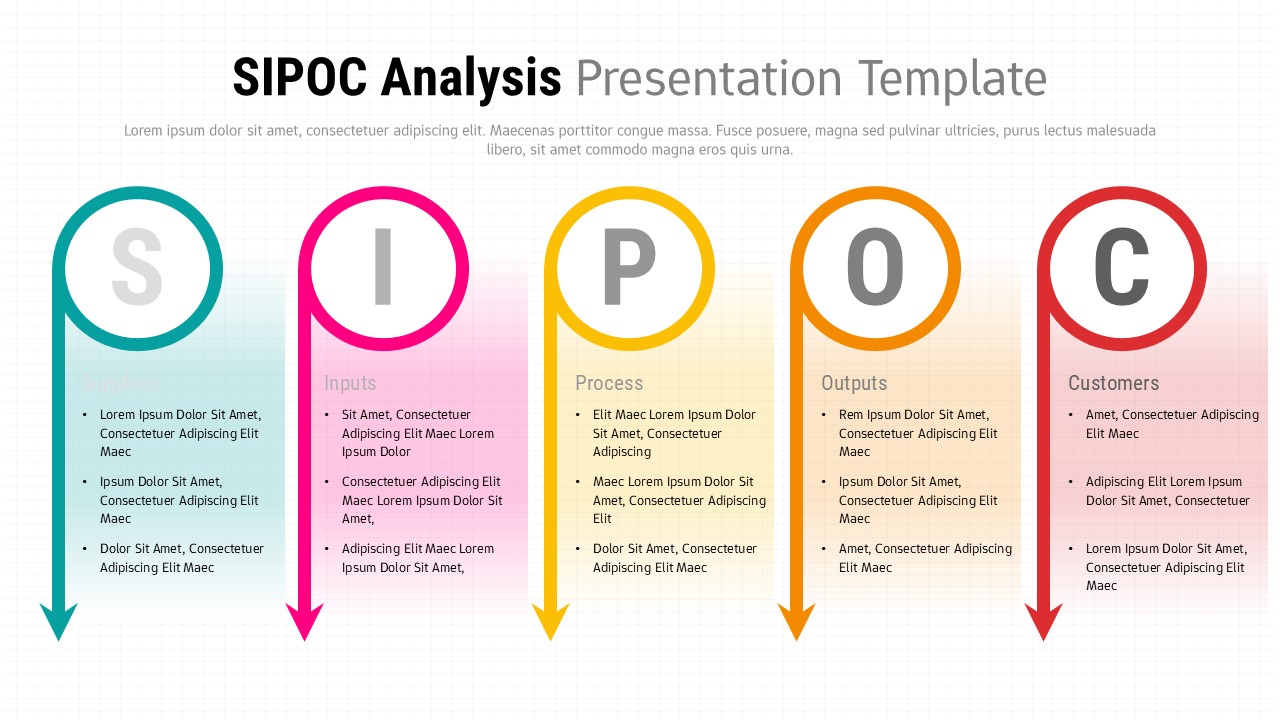
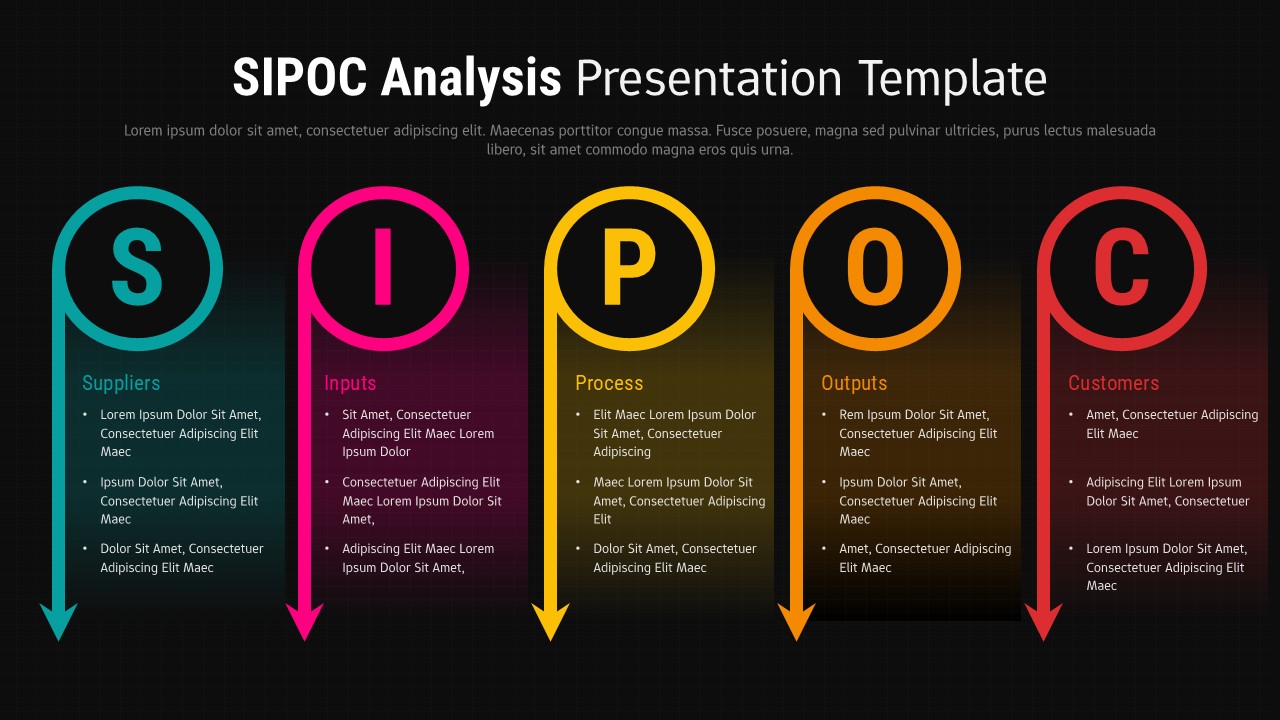
Streamline your process improvement initiatives with this professionally designed SIPOC Analysis Process Diagram Template for PowerPoint & Google Slides. Built around the five essential SIPOC components—Suppliers, Inputs, Process, Outputs, and Customers—this slide offers a clear, linear structure that guides audiences through each stage of operational analysis. The vertical arrow layout visually connects every element, reinforcing the logical flow from suppliers to customers while maintaining clarity and balance on a single slide.
The SIPOC Analysis Process Diagram Template for PowerPoint & Google Slides uses bold circular headers labeled S, I, P, O, and C, paired with color-coded columns to differentiate each section instantly. Teal highlights Suppliers, pink emphasizes Inputs, yellow defines Process, orange represents Outputs, and red distinguishes Customers. Beneath each heading, bullet point placeholders allow you to outline key stakeholders, required resources, workflow steps, deliverables, and target audiences in a structured format. The subtle grid background and modern typography enhance readability without distracting from your content.
Fully editable in both PowerPoint and Google Slides, this SIPOC Analysis Process Diagram Template for PowerPoint & Google Slides is ideal for Lean, Six Sigma, and continuous improvement presentations. Easily customize text, adjust colors to match brand guidelines, or duplicate the slide for multiple processes. Whether used in workshops, stakeholder briefings, or executive reviews, this template ensures your process overview remains concise, visual, and strategically aligned.
Features of this template
• Five vertically aligned arrow columns representing Suppliers, Inputs, Process, Outputs, and Customers.
• Color-coded circular headers with large initial letters (S, I, P, O, C) for instant recognition.
• Structured bullet point areas under each category for organized content entry.
• Clean grid background with modern typography for enhanced readability.
• Fully editable shapes, colors, fonts, and text placeholders.
Why use this template
• Clarifies complex workflows in a single structured slide.
• Supports Lean, Six Sigma, and process improvement methodologies.
• Enhances stakeholder understanding through logical left-to-right flow.
• Saves preparation time with ready-to-use, customizable layouts.
Who is it for
Business analysts, process improvement specialists, operations managers, and Lean or Six Sigma practitioners presenting workflow overviews. It is also ideal for consultants, project managers, quality assurance teams, and educators teaching process mapping or operational strategy concepts.
Login to download this file


