


Phylogenetic Evolutionary Cladogram Diagram Template


Biological Taxonomy and Species Relationship Presentation Template
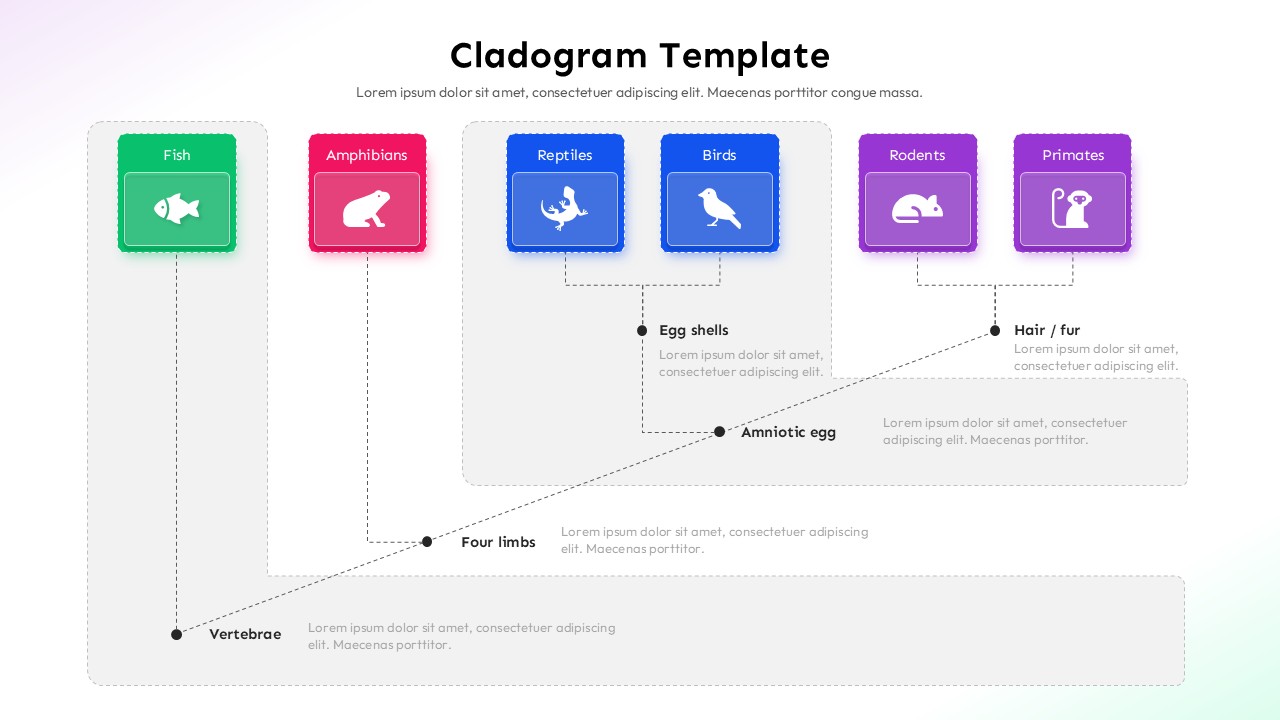
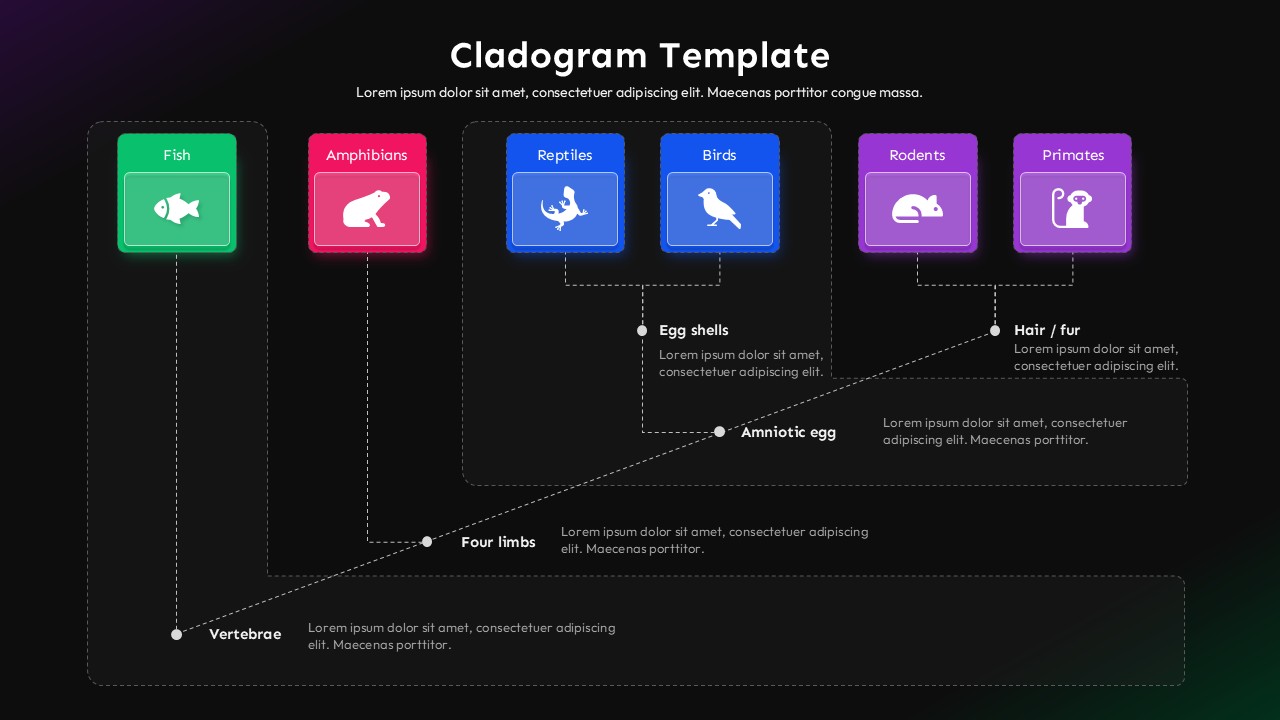
This Cladogram Template provides a structured visual for mapping evolutionary paths across six distinct animal groups. It is designed for biology instructors and students who need a clear way to show shared ancestry during a professional presentation. The use of staggered text boxes at different elevations helps separate the specific traits from the main species headers. This layout ensures the primary keyword remains visible alongside the connecting dotted lines. The color coding makes it easy to track individual clades across the entire page.
What the Cladogram Diagram Template Contains
- Six colorful header boxes for naming specific species or taxonomic groups.
- Individual icons for each category including fish and primates to aid recognition.
- Dotted branching lines that show the specific points where traits emerged.
- Descriptive text blocks next to every trait node for detailed scientific explanations.
- A wide horizontal canvas that fits six groups without crowding the screen.
What Works
- The dotted lines clearly mark the divergence points without cluttering the background.
- Icons provide a secondary visual cue that helps younger students identify groups quickly.
- Using a different color for every box prevents the eye from getting lost in a single column.
- Text boxes are placed at an angle that naturally follows the diagonal growth of the tree.
Best Situations for Cladogram Diagram Template Slide
- A university professor explaining the transition from aquatic to terrestrial life in a lecture hall.
- A high school student creating a project on mammalian traits for a science fair presentation.
- A curriculum developer building a series of worksheets for a remote learning biology module.
- A research assistant summarizing phylogenetic findings for a peer review group.
Login to download this file
Related Templates

Story Arc PowerPoint & Google Slides Templates
Illustration
Egg Diagram PowerPoint & Google Slides Templates
Illustration
World Social Media Day PPT Template
Creative


