




Editable Map Of Belgium PowerPoint & Google Slides Templates
Editable Map Of Belgium Template
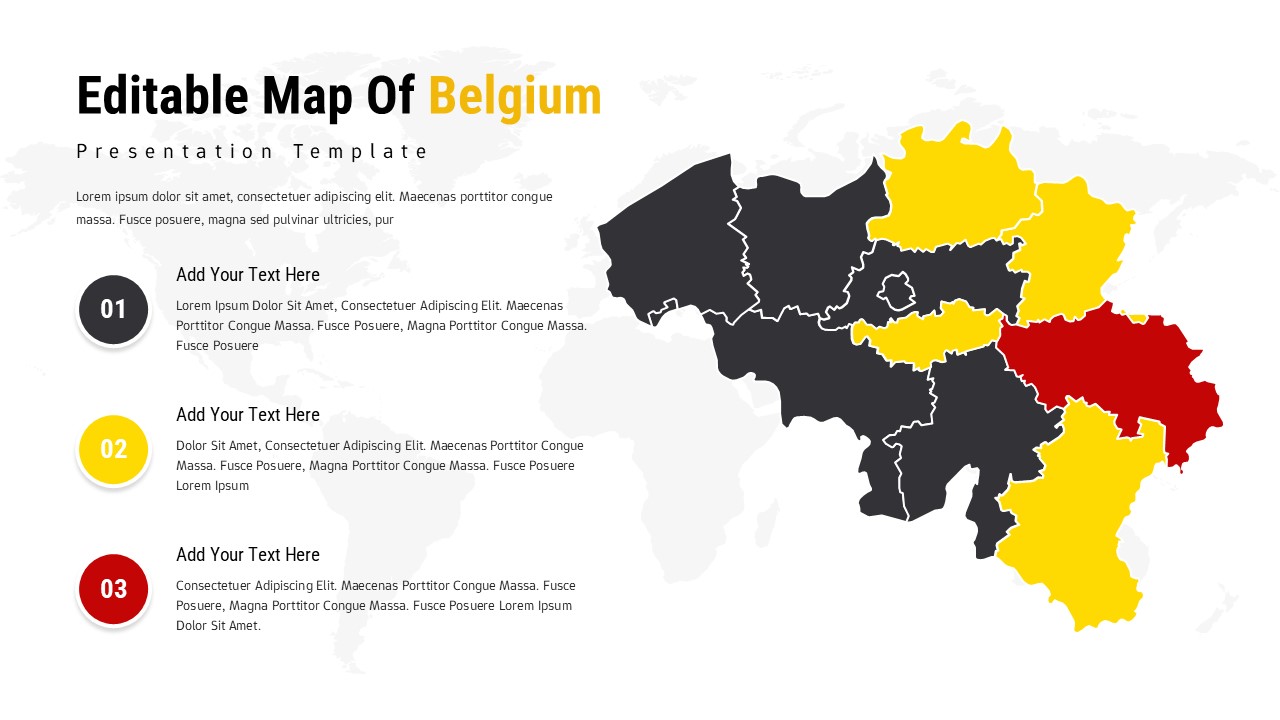
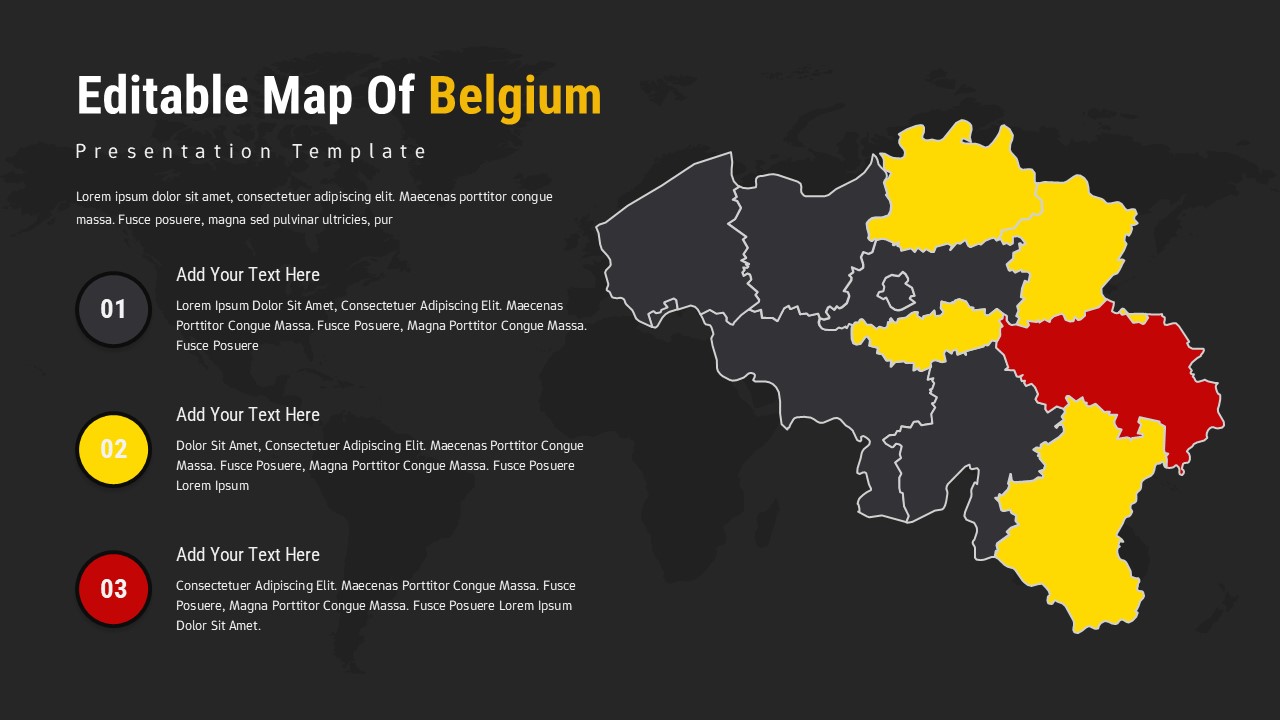
The Editable Map of Belgium Template for PowerPoint and Google Slides serves as a premier tool for professionals who need to combine geographic precision with structured data storytelling. This template features a specialized split-layout design that effectively balances a high-resolution map of Belgium with a dedicated information pane. As showcased the map is divided into distinct provincial boundaries, allowing for granular analysis and specific regional targeting. The use of a bold color palette specifically yellow, red, and dark gray enables presenters to highlight key territories and create immediate visual contrast that captures audience attention.
Key Features and Functional Design
This presentation template is engineered to simplify the delivery of complex territorial data through several built-in features:
Coordinated Numbered Sections: The layout includes three numbered bullet points (01, 02, 03) that are color-matched to specific regions on the map, ensuring the audience can easily connect data to its geographic source.
Full Customization Control: Every province and text box is a fully editable vector, meaning users can change colors, resize elements, and modify text to align perfectly with unique datasets or corporate branding.
Dual-Theme Versatility: To accommodate different presentation environments and brand styles, the template is provided in both professional light and high-impact dark theme variations.
High-Resolution Graphics: The Belgium map maintains its clarity across large screens, ensuring that provincial borders and regional details remain sharp for the viewer.
Professional Use Cases and Applications
The versatility of this Editable Map of Belgium Template makes it an essential asset across various sectors. In a Sales context, managers can use it to define and assign territories or track regional revenue growth. Business Analysts and Market Researchers find it invaluable for displaying demographic shifts or identifying untapped market potential within specific provinces. Furthermore, Educators and Government Officials can utilize the template to present geographic lessons or communicate regional economic indicators and policy impacts with clarity. By providing a pre-formatted, professional structure, this template allows users to save hours of design time while producing a high-quality visual narrative.
Login to download this file


