


Risk Heat Map PowerPoint & Google Slides Templates
Risk Heat Map Template
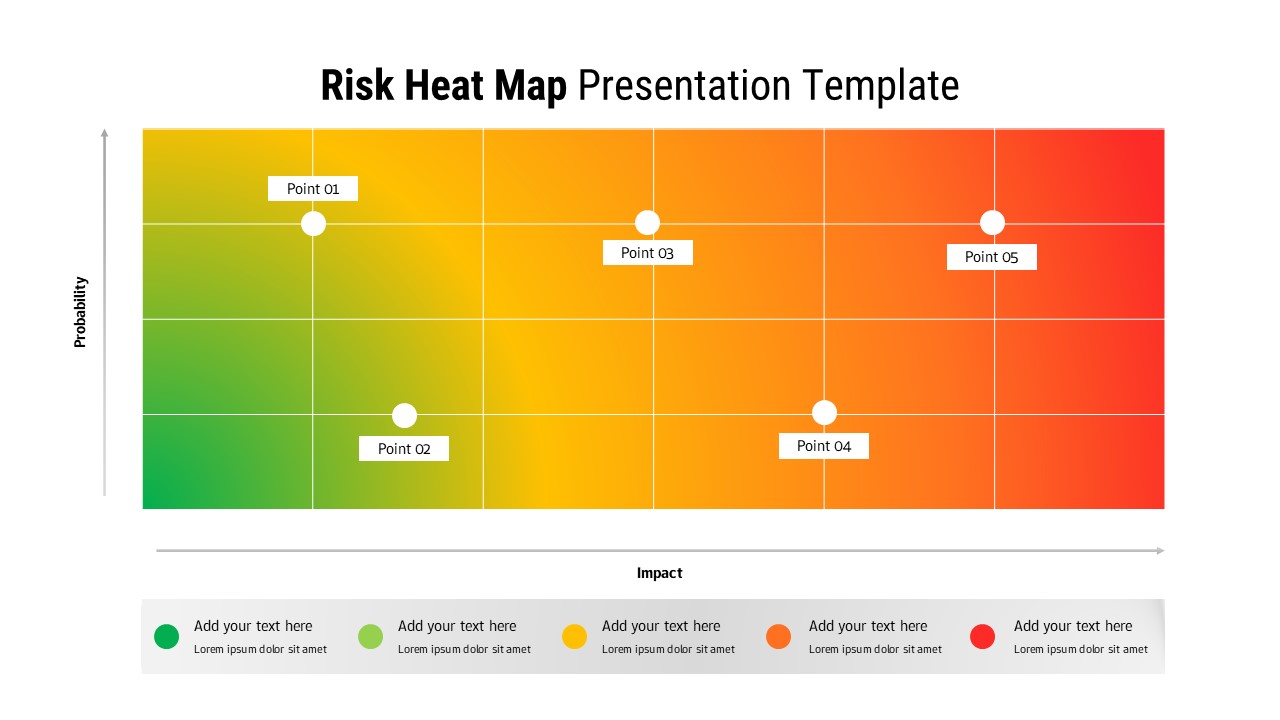
The Risk Heat Map Template for PowerPoint and Google Slides is an essential analytical framework for any organization looking to move from reactive troubleshooting to proactive risk management. By utilizing a high-fidelity 5×2 matrix, this template provides a standardized way to evaluate potential threats by measuring their Probability against their Impact. This visualization is critical because it forces a qualitative or quantitative ranking of concerns, ensuring that the “loudest” problems don’t always get the most resources the most “dangerous” ones do.
Design & Visual Hierarchy
The template is built on a sophisticated color-logic system. A seamless gradient flows from vibrant green (representing manageable, low-level risks) to a deep warning red (indicating critical threats that require immediate intervention).
- Five Dynamic Data Points: The template includes five adjustable markers that act as “pins” on your map. These are fully editable, allowing you to label specific risks like “Market Volatility,” “Data Security,” or “Supply Chain Disruption.”
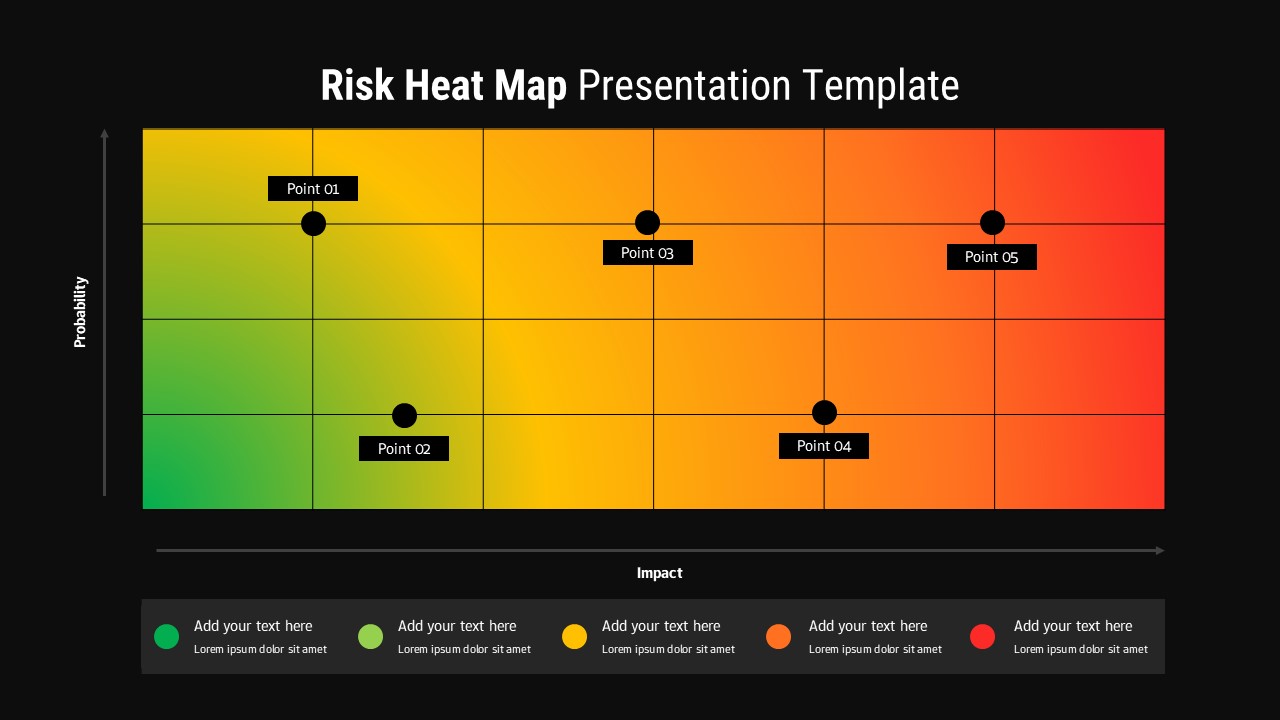
- Dual-Environment Support: Whether you are presenting in a brightly lit executive boardroom or via a virtual late-night call, the Light and Dark theme variations ensure your data remains crisp and accessible.
- Integrated Legend: To prevent ambiguity, the comprehensive legend bar allows you to define exactly what your “Low,” “Medium,” and “High” thresholds mean, ensuring every stakeholder is speaking the same language.
Transforming Data into Strategy
This template isn’t just a static image; it’s a communication bridge. For Risk Managers and Compliance Officers, it serves as a “Single Source of Truth” during audits. For Project Managers, it acts as a visual roadmap during the planning phase to identify potential bottlenecks before they occur. By plotting data points on this heat map, you transform abstract worries into a prioritized checklist.
The visual nature of the matrix makes it perfect for Stakeholder Briefings where time is limited. Instead of reading through a 50-page risk register, executives can glance at the red zone of the heat map and immediately understand where their attention & budget is most needed.
Core Advantages
- Action-Oriented: Moves beyond listing risks to prioritizing them based on severity.
- Executive-Ready: High-end design aesthetics suitable for C-suite and Board of Directors presentations.
- Total Customization: Every axis label, color block, and data marker is a vector element, meaning you can scale and recolor them to match your specific corporate identity or project criteria.
- Consistency: Provides a repeatable format for monthly or quarterly risk reviews, making it easier to track how risks move across the map over time.
Ideal For:
This template is the professional standard for Business Analysts, Audit Teams, Strategic Planners, and Scrum Masters. It provides the necessary structure to facilitate high-level strategic planning sessions, conduct project post-mortems, or simply maintain a clear, transparent view of the hurdles standing between your team and its objectives.
Login to download this file


