


Performance Analysis PowerPoint & Google Slides Templates


Performance Analysis Presentation Template
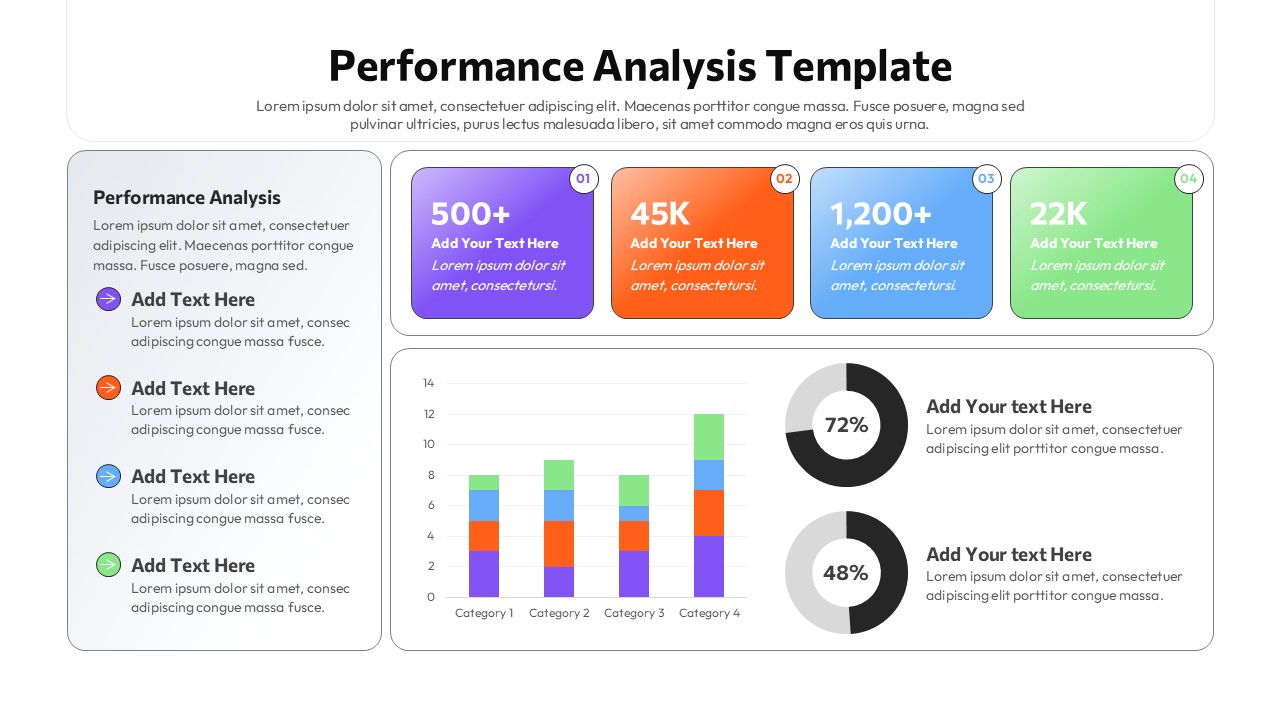
When your numbers tell a story that matters, the slide carrying them has to do its job without getting in the way. The performance analysis template is built for exactly that moment, when you need an audience to grasp scale, spot patterns, and reach a conclusion before the Q&A begins.
It leads with magnitude. Four high-contrast metric cards dominate the top, each anchored by a bold stat that lands before anyone reads the supporting copy. A stacked bar chart and dual donut indicators handle the detail, so every person in the room leaves with the same understanding regardless of their data literacy.
The left-hand panel holds narrative context beside the data zone so your story and your evidence work together, not against each other. The hierarchy is set before you open your mouth.
Use it in quarterly reviews, investor updates, and team readouts. In PowerPoint, link live data from Excel so figures stay current right up to the moment you present. In Google Slides, share it as a collaborative document your team updates together before it goes live.
With fully editable slides, clean data visualization, and a modern 16:9 format, this business presentation asset is ready to carry real stakes.
What’s Inside This Performance Analysis Template
- Four KPI cards with numbered labels so the most critical metrics land in seconds, before a single word is read.
- Stacked bar chart across four categories so multi-variable comparisons resolve into one readable visual.
- Dual donut charts with percentage callouts so proportional progress reads separately from trend data at a glance.
- Modular narrative panel so spoken commentary and on-screen evidence stay in sync throughout the presentation.
Why It Works
- Audiences reach conclusions faster because the layout mirrors how decisions actually get made: big number first, context second, trend third.
- Prep time drops because the structure is already solved. You fill in numbers, not layouts.
- The professional slides aesthetic signals rigor before a single figure is discussed.
- One shared customizable template keeps every performance review looking consistent across decks and teams.
Built For
Analysts, team leads, and department heads who need to turn data into a recommendation, not just a report, for stakeholders with limited time and high expectations. Also built for consultants and strategists who need visual storytelling that holds up in a boardroom without a lengthy walkthrough. If you’re regularly asked to make the numbers make sense, this slide does that work for you.
Login to download this file


