


Dark Financial Dashboard Analytics Template for PowerPoint & Google Slides


Modern Financial Dashboard Analytics Presentation Template
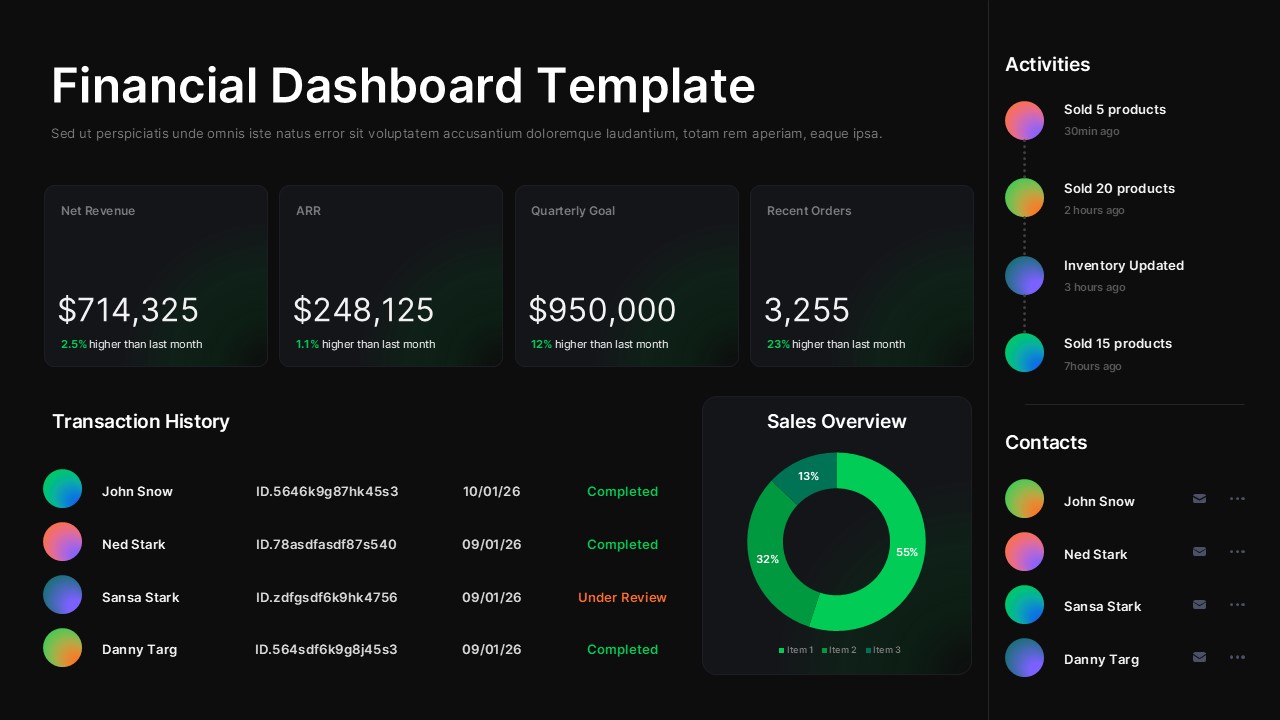
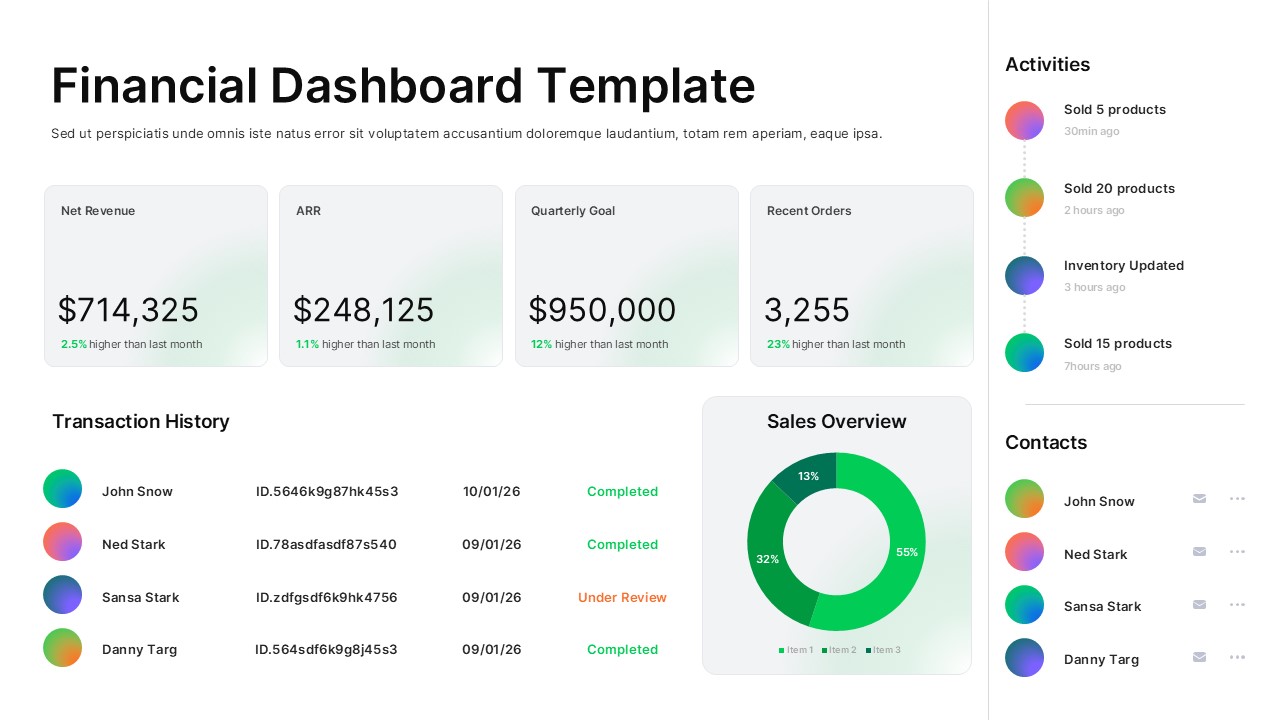
This dark financial dashboard is designed to help teams present complex business metrics with clarity, structure, and visual confidence. The layout features a high-contrast dark background combined with luminous data cards, KPI tiles, and a circular sales chart, making financial insights easy to scan during meetings or executive reviews. Key indicators such as net revenue, ARR, quarterly goals, and recent orders are displayed in dedicated panels, allowing stakeholders to understand performance at a glance. The financial dashboard structure supports fast comprehension while maintaining a sleek, modern aesthetic suitable for professional environments.
Built for flexibility, this financial dashboard adapts seamlessly to monthly reports, quarterly reviews, and real-time performance summaries. Transaction history tables, activity timelines, and contact lists are arranged in a clear grid system, ensuring balance between data density and readability. Subtle gradients and rounded containers guide the viewer’s eye without distracting from the numbers. Whether used as a standalone slide or as part of a larger deck, the composition keeps financial data organized and visually consistent across presentations.
Optimized for both PowerPoint and Google Slides, this financial dashboard enables easy customization without design expertise. Users can quickly update figures, adjust labels, or recolor elements to match brand guidelines. The dashboard format is ideal for recurring reporting, helping teams save time while delivering polished, decision-ready visuals. From executive briefings to internal performance tracking, this slide transforms raw financial data into a clear, compelling narrative.
Features of this Financial Dashboard template
• Dark UI dashboard layout with high-contrast KPI cards and clear hierarchy
• Dedicated sections for revenue, ARR, goals, orders, and transaction history
• Circular sales overview chart for quick percentage comparisons
• Fully editable text, colors, charts, and icons in PowerPoint and Google Slides
Why use this Financial Dashboard template
• Presents financial data in a clean, executive-ready dashboard format
• Improves readability of key metrics with structured panels and spacing
• Saves time on recurring reports and performance updates
• Enhances visual impact while maintaining a professional tone
Who is it for
Finance managers, startup founders, product leaders, analysts, and operations teams presenting financial performance, KPIs, or sales activity. It also suits consultants preparing client reports, executives sharing board updates, and teams building internal dashboards for ongoing tracking.
Login to download this file


