


Three Column Comparison Chart Layout Template for PowerPoint & Google Slides
Three Column Product Comparison Chart Presentation Template
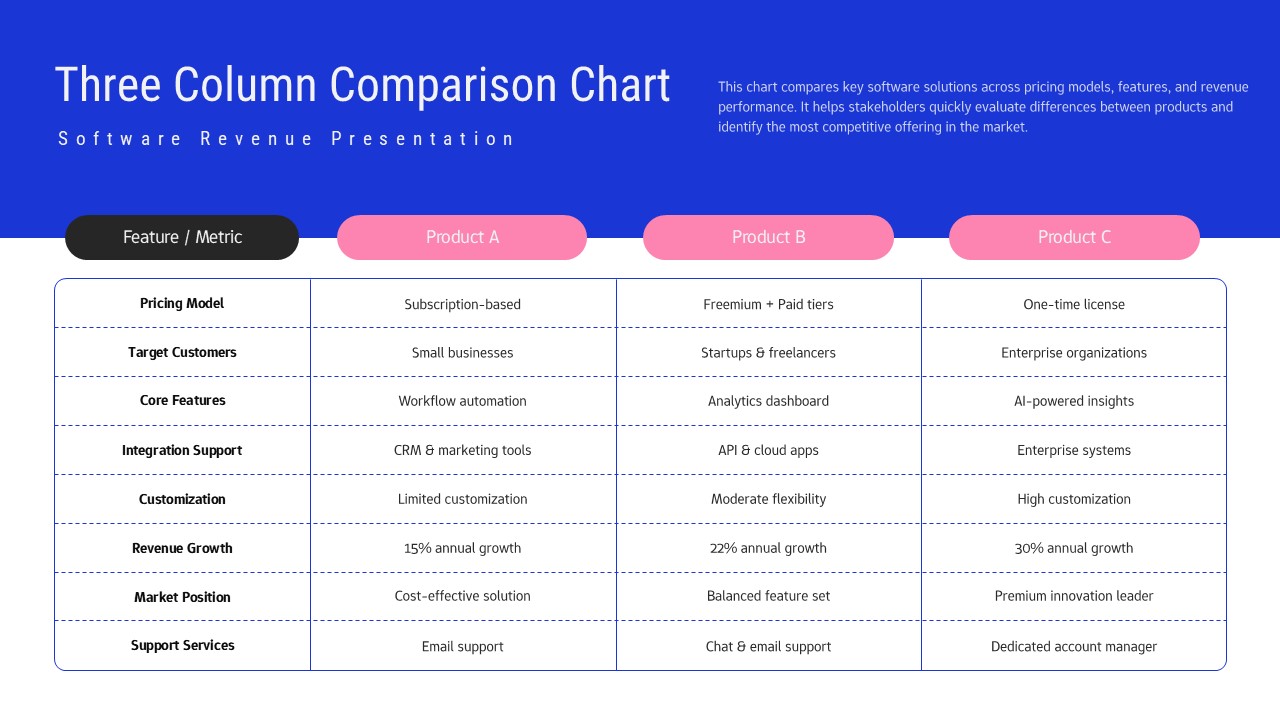
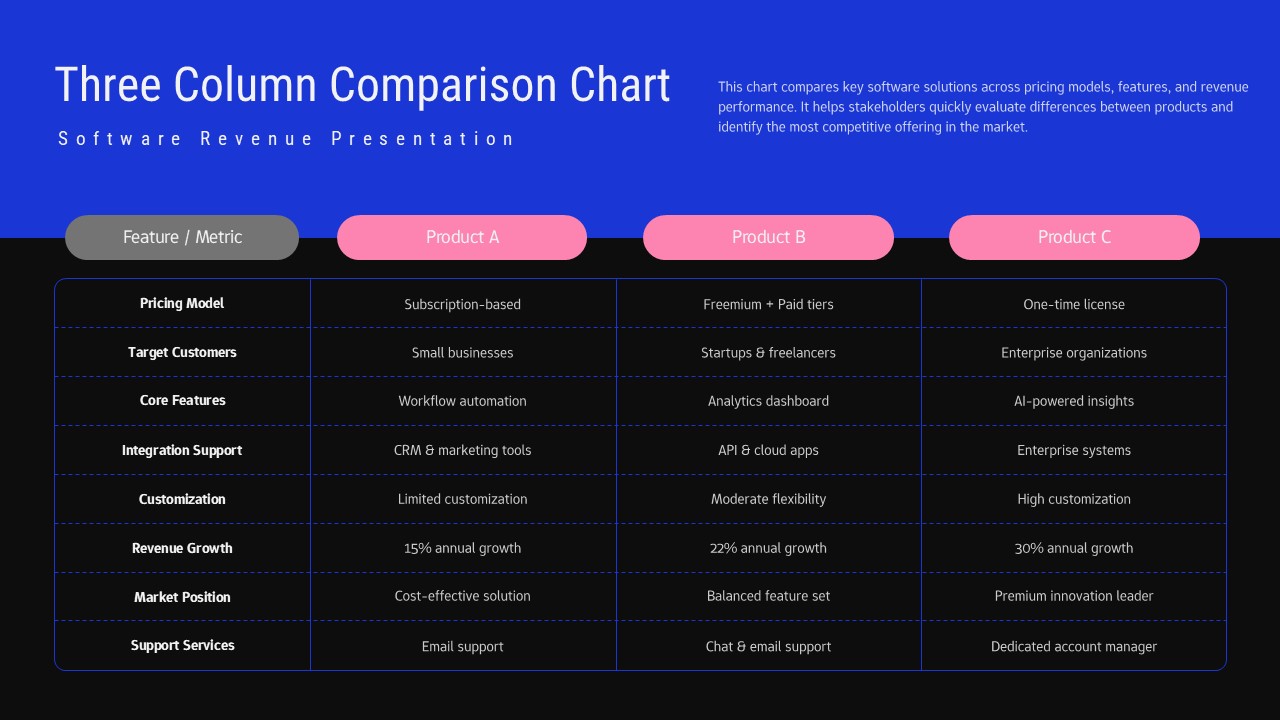
This Three Column Comparison Chart Template for PowerPoint & Google Slides provides a clean, professional layout for side-by-side comparisons. Features a structured table format with rounded header buttons in vibrant pink, dark charcoal feature labels, and organized rows for systematic comparison. Available in both bright blue and sophisticated dark themes, the template ensures excellent readability with high contrast colors and modern design elements that maintain visual consistency across presentations.
This Three Column Comparison Chart Template for PowerPoint & Google Slides is ideal for software companies, product managers, and business analysts presenting competitive analysis, feature comparisons, or product positioning. Perfect for board meetings, investor pitches, sales presentations, and strategic planning sessions where clear comparison of products, services, or solutions is essential. The template supports revenue performance metrics, market positioning data, and detailed feature differentiation effectively.
The template offers full customization with editable text placeholders, adjustable color schemes, and flexible row configurations. Users can easily modify content, add or remove comparison criteria, and adapt the design to match brand guidelines. This streamlines presentation preparation while ensuring professional, consistent visual communication that enhances decision-making processes.
Features of this template
• Professional three-column comparison table with organized feature rows
• Dual theme options: vibrant blue and sophisticated dark variants
• High-contrast color scheme with pink headers and charcoal feature labels
• Rounded design elements for modern, corporate appearance
• Structured layout supporting detailed product and revenue comparisons
Why use this template
• Streamlines competitive analysis and product comparison presentations
• Ensures consistent, professional visual communication across teams
• Saves time with pre-formatted comparison structure and design
• Enhances stakeholder understanding through clear, organized data display
Who is it for
This template is perfect for software companies, product managers, business analysts, sales teams, consultants, and executives who need to present competitive analysis, product comparisons, feature differentiation, revenue performance, or strategic positioning to stakeholders, investors, clients, or internal teams during meetings and presentations.
Login to download this file


