


Ratings and Rankings Chart PowerPoint & Google Slides Templates


Ratings and Rankings Chart Template
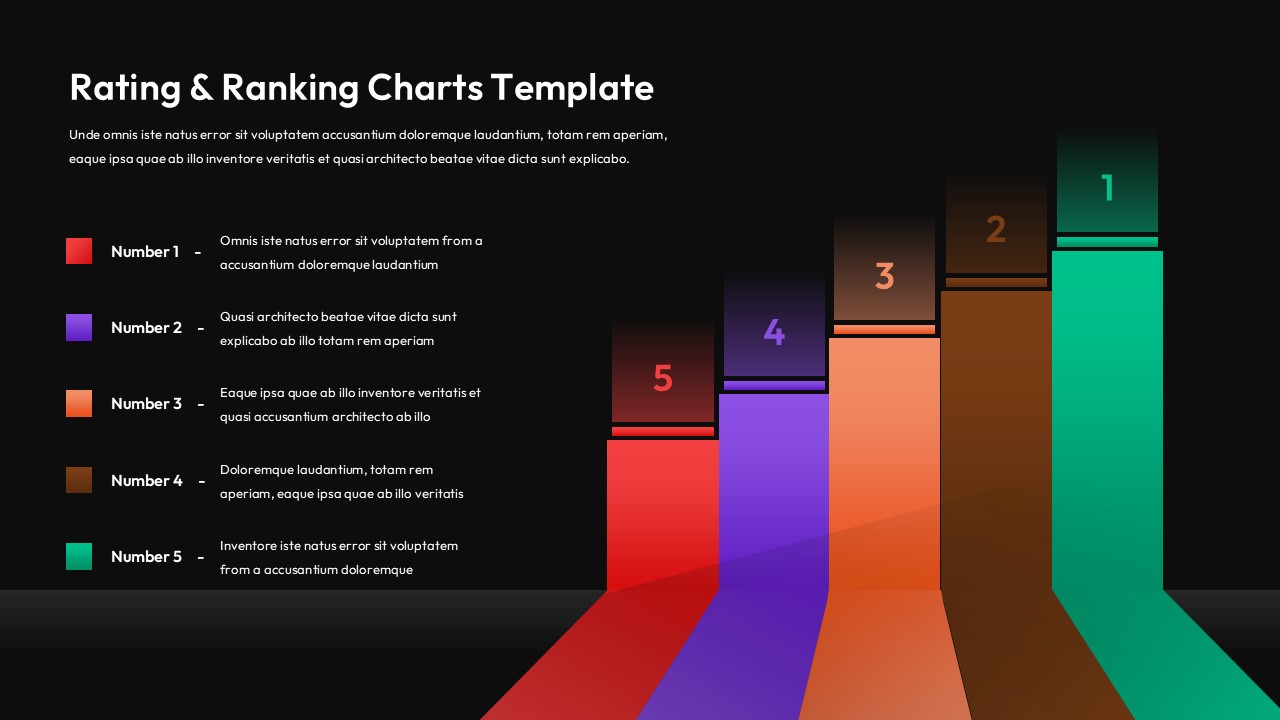
This Rating & Ranking Charts Template provides a vertical hierarchy of achievement to solve the problem of overwhelming datasets. It is designed specifically for business analysts and marketing managers who need to translate complex research into a format that executives can act upon quickly during a strategy session. The staggered bar design grows in height from left to right, creating a natural sense of progression that guides the viewer through your competitive landscape or project milestones. This layout ensures that your primary keyword and supporting data remain organized while providing an immediate visual anchor for high-to-low transitions.
The file contains five distinct vertical columns, each assigned a unique color and number to prevent any visual confusion. These elements correspond directly to a left-aligned text legend, which offers dedicated space for detailed qualitative descriptions alongside your quantitative scores. Because this is a vector-based design for PowerPoint and Google Slides, you can easily modify the bar heights or swap the color palette to match your specific corporate brand identity. This flexibility allows you to repurpose the slide for various contexts, such as customer satisfaction surveys or employee performance reviews.
This tool works best during a quarterly business review where team accomplishments need to be ranked against specific KPIs. It is also an ideal fit for market research debriefs that require a clear visual hierarchy of consumer brand preferences or product quality ratings. Project leads often reach for this format when illustrating the priority of different tasks within a larger development roadmap. By utilizing this 16 by 9 aspect ratio presentation template, you save hours of manual alignment time while delivering a persuasive, data-driven narrative to your stakeholders. Using this professional chart helps simplify complex comparative information into an easily digestible format for effective decision-making.
Login to download this file


