




Multiple Project Status Report PowerPoint & Google Slides Templates
Multiple Project Status Report Template
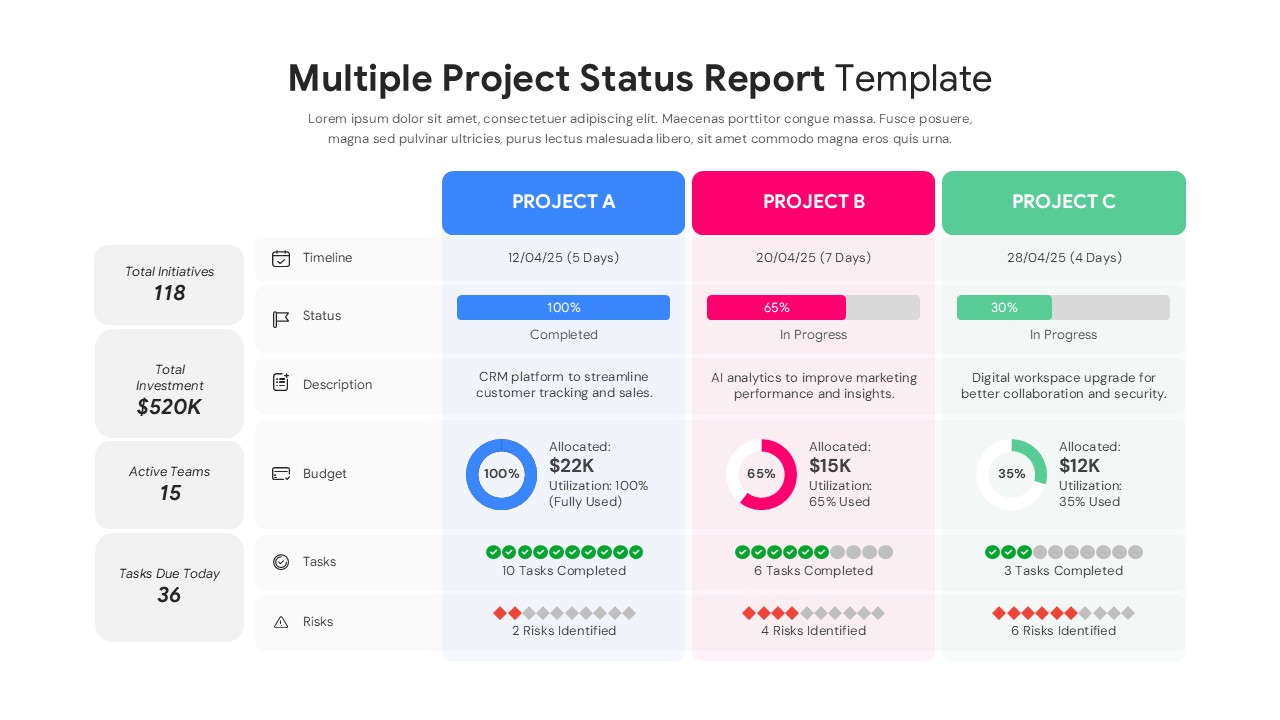
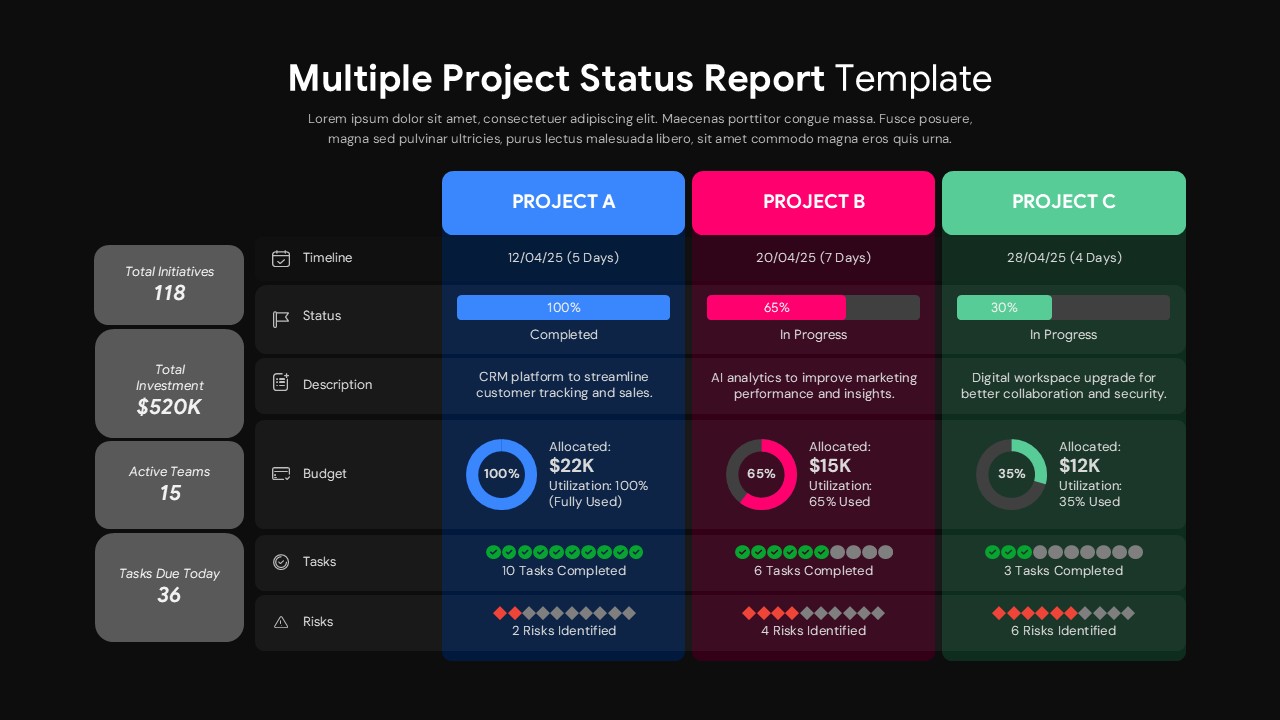
This Multiple Project Status Report Template for PowerPoint & Google Slides provides a structured, side-by-side comparison dashboard for up to three concurrent projects. Each slide features a three-column grid with six labeled rows covering Timeline, Status, Description, Budget, Tasks, and Risks. Visual elements include color-coded project headers in blue, pink, and green, progress bars, donut charts for budget utilization, and icon-based task and risk indicators. A left sidebar displays four KPI summary cards. Both a light and a dark theme are included, offering a polished enterprise dashboard aesthetic in 16:9 format.
This Multiple Project Status Report Template for PowerPoint & Google Slides is ideal for project managers, PMO directors, and operations leaders who need to communicate multi-project performance clearly and efficiently. It suits quarterly business reviews, executive stakeholder briefings, board-level portfolio updates, and weekly PMO stand-ups. The dual-theme design ensures compatibility with branded corporate presentations and dark-mode environments alike. Whether you are tracking three active workstreams or presenting cross-functional initiatives to C-suite leadership, this template delivers structured clarity without sacrificing visual impact.
Every element in this template is fully editable in both Microsoft PowerPoint and Google Slides. Swap placeholder text, update KPI values, adjust progress bar lengths, and replace donut chart data to reflect your real project metrics in minutes. The modular grid layout scales easily, and the dual light and dark themes give you instant flexibility. Download once and adapt it for every reporting cycle, saving hours of slide-building time while maintaining a consistent, professional presentation standard.
Features of this template
• Dual light and dark theme slides for versatile presentation environments
• Three-column project comparison grid with six structured data rows
• Visual progress bars and donut charts for status and budget tracking
• Icon-based task completion and risk identification indicators
• Four KPI summary cards in a dedicated left sidebar panel
Why use this template
• Presents multi-project portfolio data in a single, scannable executive view
• Color-coded columns make project differentiation instant and intuitive
• Saves significant design time with a ready-made, professional dashboard layout
• Compatible with both PowerPoint and Google Slides for seamless team collaboration
Who is it for
This template is designed for Project Managers, PMO Directors, and Operations Managers who oversee multiple workstreams simultaneously. It is equally valuable for C-suite executives and Board members requiring high-level portfolio visibility, Business Analysts preparing stakeholder status updates, and Team Leads coordinating cross-functional projects across departments.
Login to download this file


