


Fishbone Cause and Effect Analysis Infographic Template for PowerPoint & Google Slides

Fishbone Cause and Effect Diagram Presentation Template
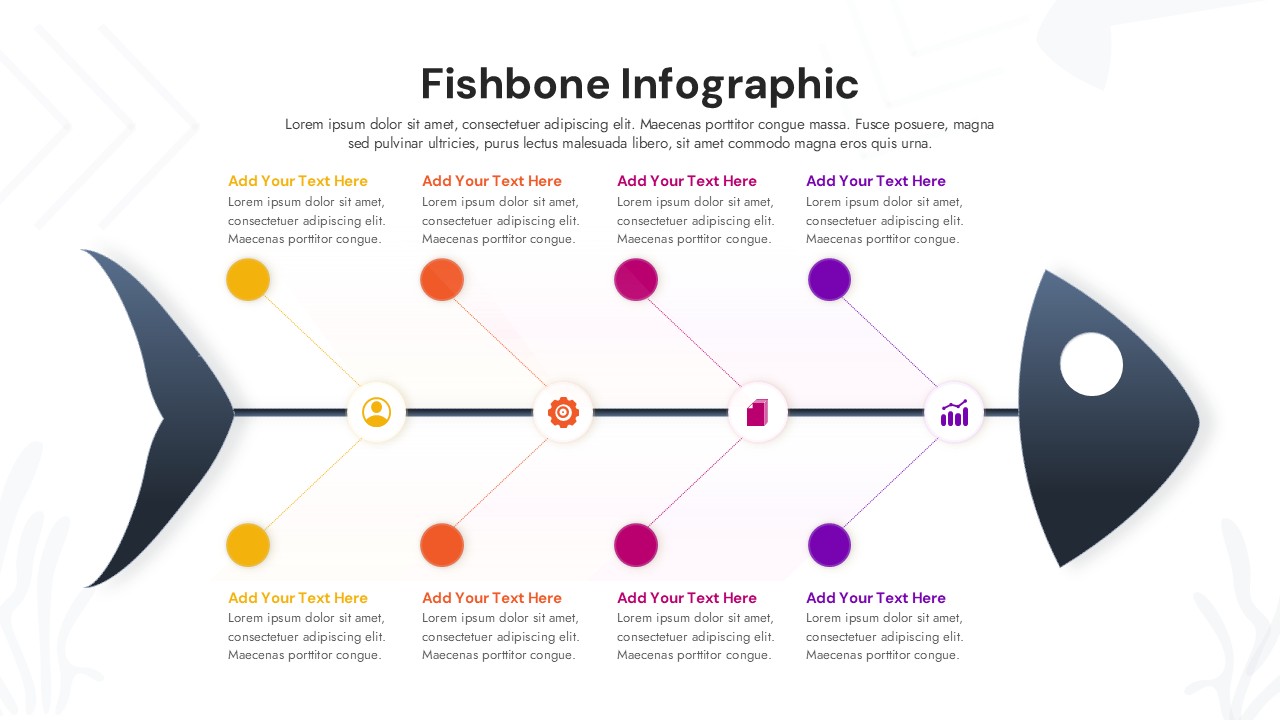
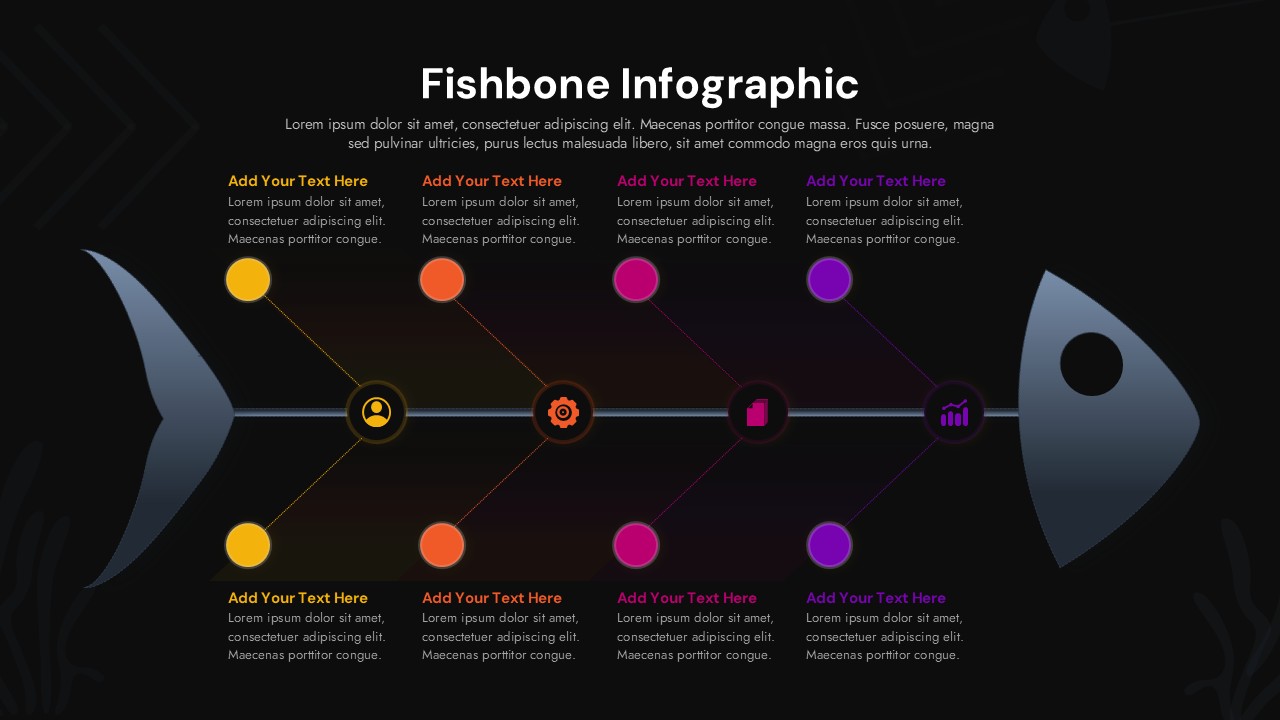
This fishbone cause and effect analysis infographic is designed to help teams visually break down complex problems into clear, structured root causes. Using a horizontal fishbone layout, the template places the main problem or outcome at the head while multiple contributing factors branch out symmetrically along the spine. Each branch includes a bold circular marker, an icon placeholder, and supporting text space, making it easy to categorize causes such as process, people, tools, or data. The clean spacing and balanced alignment ensure that the fishbone cause and effect analysis remains easy to follow, even when presenting layered information to large audiences.
Built for clarity and flexibility, this fishbone cause and effect analysis slide works seamlessly in PowerPoint and Google Slides. All shapes, connectors, icons, and text fields are fully editable, allowing you to rename categories, adjust colors, or reorder elements without disrupting the structure. The modern infographic style supports workshops, retrospectives, and executive reviews where fast comprehension is critical. By visualizing cause-and-effect relationships in a single view, this template helps teams move from discussion to actionable insight with confidence.
Features of this Fishbone cause and effect analysis template
• Horizontal fishbone layout with a central spine and clearly connected cause branches.
• Color-coded circular nodes to separate and highlight different cause categories.
• Editable icons and text placeholders for quick customization.
• Clean, professional design optimized for widescreen presentations.
Why use this template
• Simplifies root cause analysis and problem-solving discussions.
• Improves audience understanding with a structured visual flow.
• Saves time compared to building complex diagrams from scratch.
• Works consistently across PowerPoint and Google Slides platforms.
Who is it for
Project managers, quality teams, consultants, analysts, and business leaders conducting root cause analysis, process reviews, or continuous improvement sessions.
Login to download this file


