




3D Clustered Bar Chart PowerPoint Template for Data Comparison
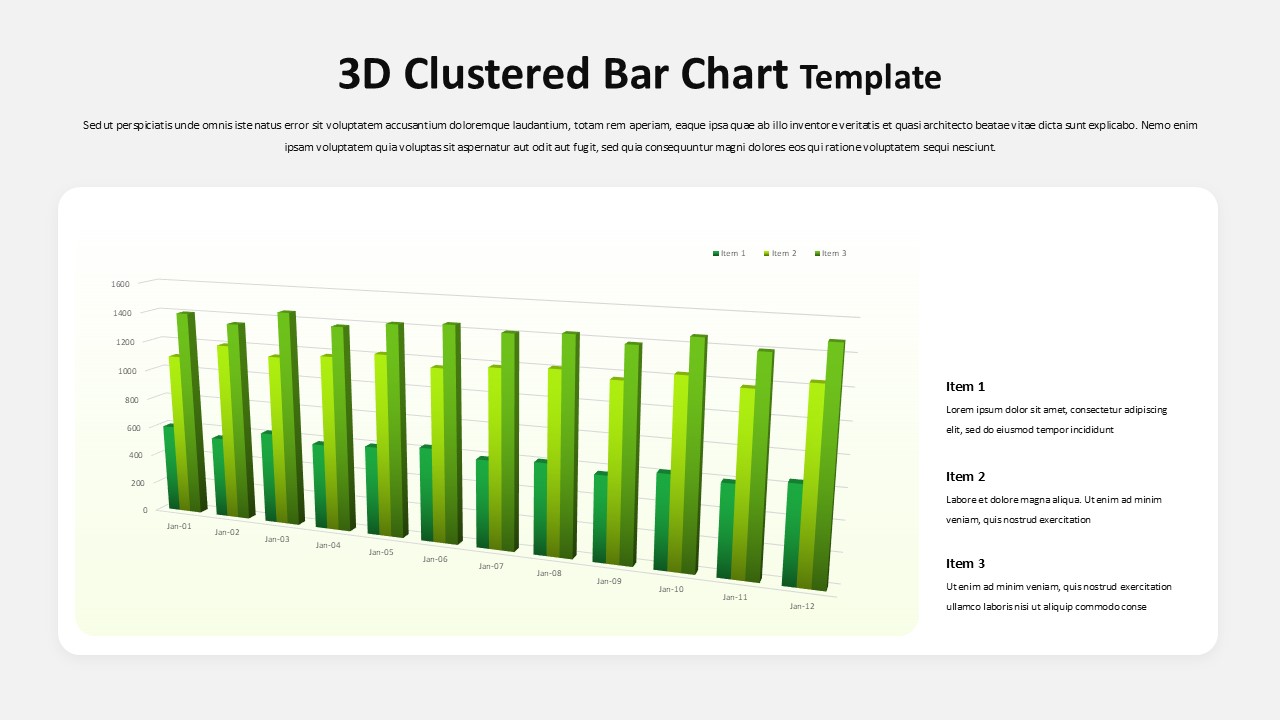
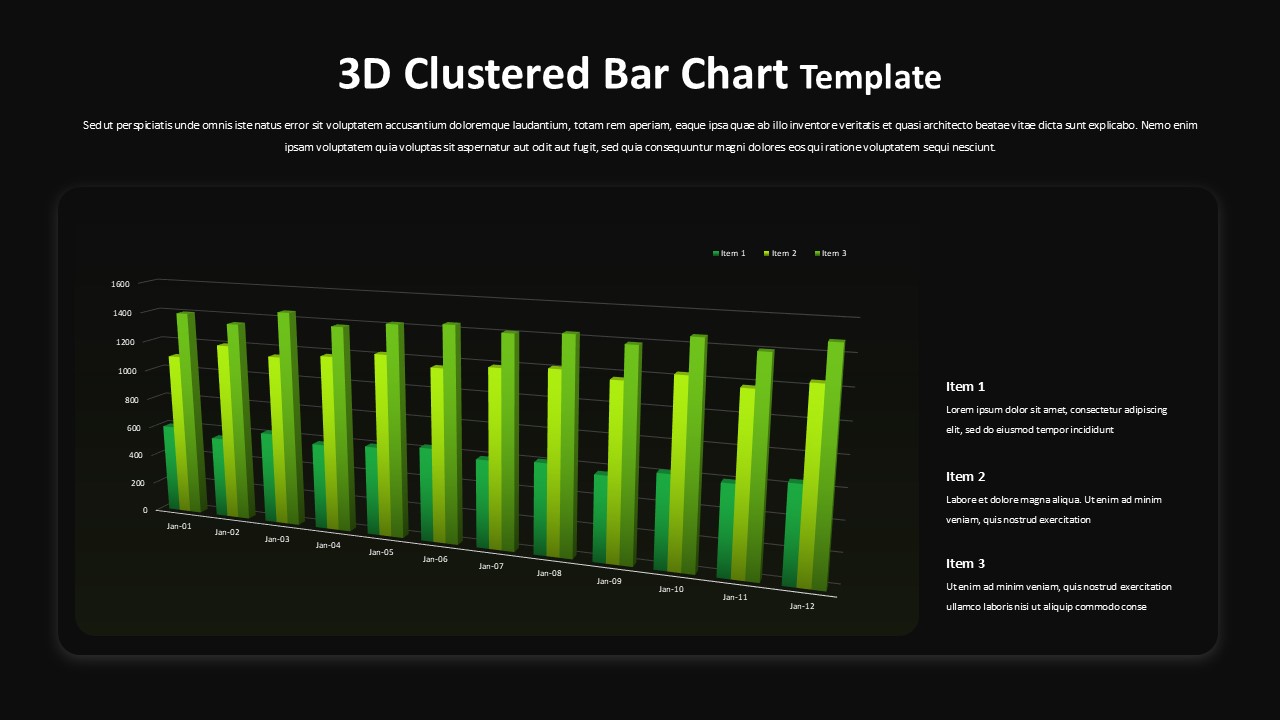
The 3D Clustered Bar Chart PowerPoint Template helps you present side-by-side comparisons with depth and clarity. This 3D clustered bar chart groups horizontal bars by category, so your audience can compare several data series at once, such as quarterly sales across regions or product performance over several years. The three-dimensional styling adds visual weight to each bar without cluttering the slide. That makes this 3D bar chart template a strong fit for boardroom reviews, investor updates, and classroom presentations.
Why Use a 3D Clustered Bar Chart Template
A flat bar graph often hides small differences, while a 3D grouped bar chart draws the eye straight to them. Each cluster in this clustered bar chart sits on a shared baseline with clear spacing between categories. The color-coded series make patterns easy to spot even from the back of a room. Longer category labels fit comfortably along the vertical axis, so the horizontal 3D bar graph works especially well for survey results, department rankings, and market share breakdowns. Data labels and a legend help viewers read the exact figures behind every bar in the 3D clustered bar diagram.
Ways to Use This 3D Grouped Bar Chart
Use these 3D clustered bar chart slides to report financial results, track KPIs against targets, or show how customer segments respond to different campaigns. Project managers can use the clustered bar graph template to compare planned and actual progress across workstreams. HR teams can present headcount or training data by department. Educators can turn research findings into a 3D comparison bar chart that students grasp quickly. Whenever you need to show how several groups measure up against each other, this 3D multi-series bar chart keeps the story clear and focused.
Fully Editable 3D Clustered Bar Chart PPT for PowerPoint
This 3D clustered bar chart PPT is data-driven. Update the values in the built-in spreadsheet and the bars resize automatically. You can recolor each series to match your brand palette, rename categories, add or remove data series, and change fonts in a few clicks. The 3D clustered bar chart template works in PowerPoint and also comes as a Google Slides version, so your team can edit and share it on either platform. To build a complete data presentation, pair this 3D bar chart PowerPoint slide with our data-driven chart templates.
Download the 3D Clustered Bar Chart PowerPoint Template and turn complex comparisons into clear visual insights your audience will remember.
Login to download this file


